Aims
Can unmanned aerial vehicle (UAV) images capture where rhizoctonia patches occur? Can we use these images to formulate a treatment approach to use when applying fungicide at sowing in the next wheat or barley crop?
Results
Ten sites sown to wheat or barley (plus one lupin crop) were monitored in 2014-2016 in the Esperance and South Stirlings district.
Rhizoctonia could be clearly identified in both the normal and normalised difference vegetation index (NDVI) UAV images produced for each paddock. In 2015, sites were flown three times, from July to September and across sites and environments; all images were useful, that is there was no particular time/growth stage that consistently produced better images – weather (wind) at the time of the flight is more important.
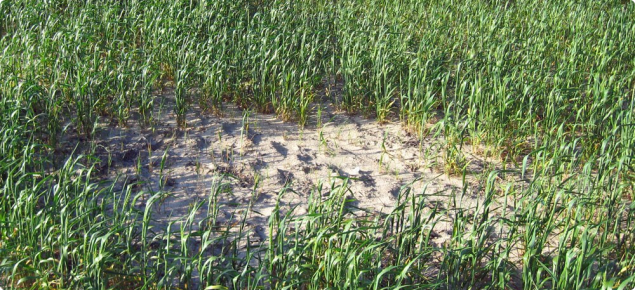
A selection of rhizoctonia patches observed on UAV images were ground-truthed with root disease assessments and PredictaB results confirming that patches were primarily caused by rhizoctonia, although nematodes were present at seven out of ten sites.
Grain yield losses within the monitored patches ranged from 9-96% with strong site and seasonal effects; the average yield penalty was 60% in 2015. There was also a decrease in barley grain quality in screenings, grain weight and hectolitre.
Images showed how levels of rhizoctonia varied substantially across paddocks and sites so that zoning for treatment applications at sowing would be useful in some paddocks while in others a blanket application of fungicide is likely to give a better economic return.
Mapping rhizoctonia patches manually in a geospatial information system (GIS) program is arduous, taking days to do, but good progress is being made in the development of software to automate this process which will give growers and consultants a useful tool. The program uses images to quantify the area of rhizoctonia present and where patches are, simplifying the process of identifying which paddocks are worth treating. The output is a shape file that can be uploaded for zoned treatment applications if desired.


