Summary
The current rainfall outlook for the South West Land Division (SWLD) for the next three months, July to September, indicates mixed chances of exceeding median rainfall. Warmer temperatures than usual are anticipated to persist.
Key Points to Consider:
- The Bureau of Meteorology’s temperature outlook for July to September and extending to August to September indicates above-average maximum and minimum temperatures, with an 80% chance of exceeding median temperature.
- The El Niño Southern Oscillation (ENSO) remains neutral, with 3 climate models indicating a La Niña from September, and 4 indicating neutral conditions to continue.
- The Indian Ocean Dipole (IOD) is currently neutral. Only one out of 5 models, the French Meteo model, is suggesting a positive IOD developing in July. The UK Met model is indicating a negative IOD developing from September.
- Southern Annular Mode (SAM) is currently neutral but is expected to be positive for July. In winter, a positive SAM reduces rainfall in the SWLD as the westerly winds and cold fronts contracts towards Antarctica.
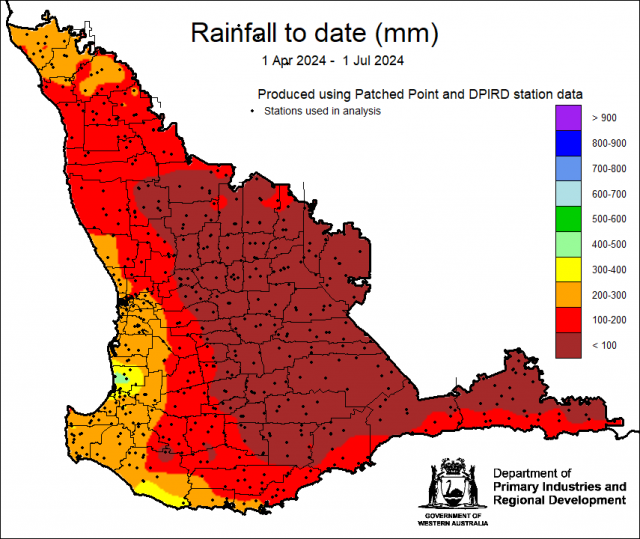
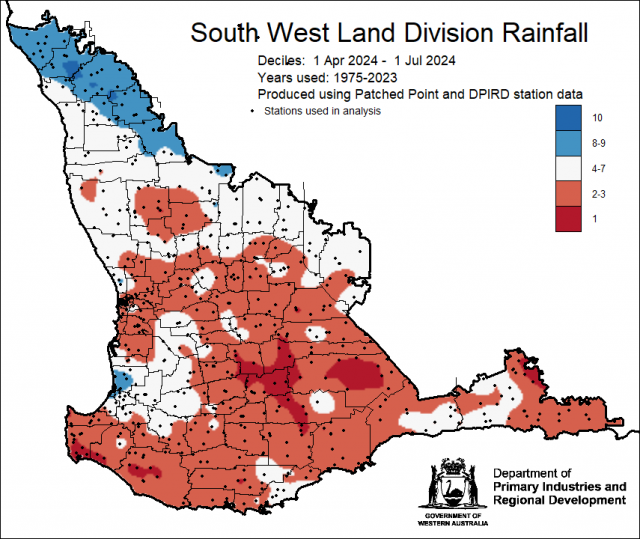
- Growing season rainfall is above average for the northern grainbelt due to tropical feed from warmer than normal sea surface temperatures in June. A consistently persistent blocking high pressure system has reduced rainfall for the interior, with much of the grainbelt tracking at below decile 3 rainfall.
- The Bureau’s Water and the Land is indicating 1-25 mm rain for the SWLD for the first week of July, from a cold front forecast on the 7 July.
Rainfall Outlook for the South West Land Division
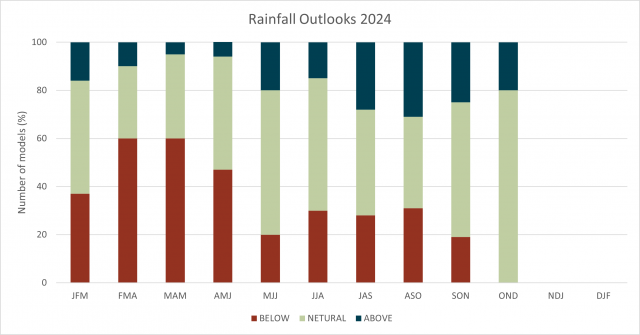
A summary of 18 national and international models reveals that 8 models suggest neutral chances of exceeding median rainfall for the SWLD for July to September 2024 with four indicating below and four indicating above.
Looking further ahead, the majority of models also predict a neutral chance of exceeding median rainfall right through to the end of the year. It’s important to note that a neutral outlook does not imply average rainfall but rather normal climatic conditions, where anything is possible.
Mean Sea level Pressure (MSLP)
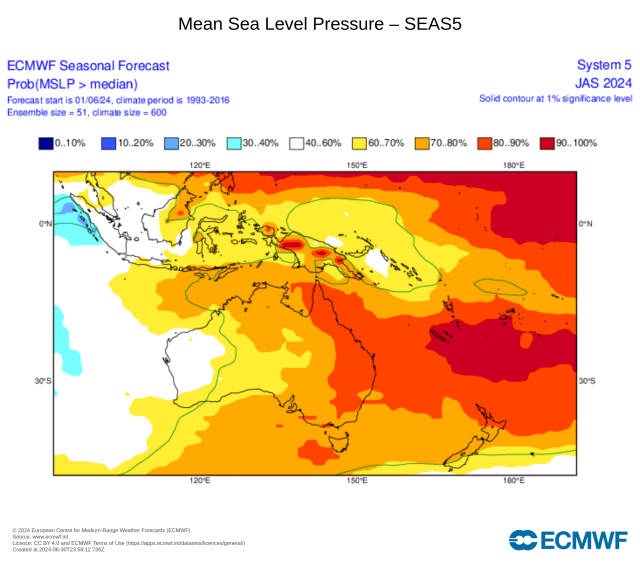
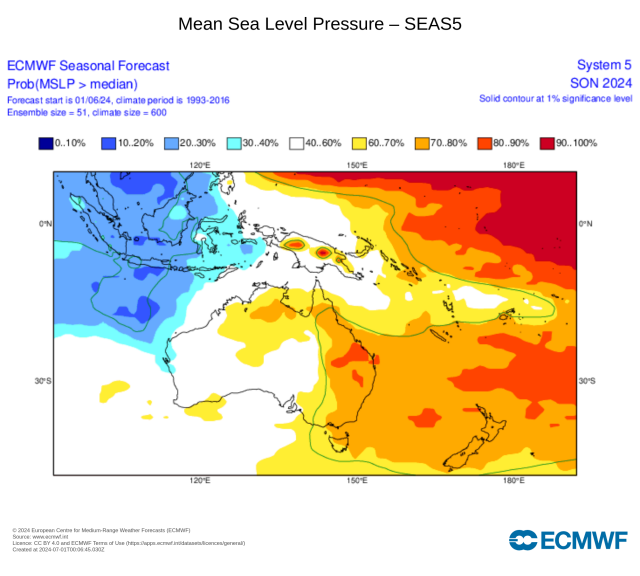
Rainfall in the South West Land Division has been below average for the majority, due to the persistent blocking high pressure system. European Centre for Medium-Range Weather Forecasts produce a variety of charts which include a forecast for MSLP. The three month charts for July-September and August to October indicates that the MSLP will remain higher than normal over Australia, which may mean that rainfall for the interior is reduced. The outlook for spring, September to November, indicates a normal MSLP pattern, indicating normal rainfall is expected for spring.
Recent Climate
The highest rainfall total since 1 April in the South West Land Division is Myalup, near Bunbury, with 450 mm.
Rainfall in the Central West forecast district, is also above average from heavy rain in June, with Binnu receiving 280 mm. The rest of the South West Land Division have received less than 100 mm for the first half of the year and are currently tracking at decile 1-3 rainfall.
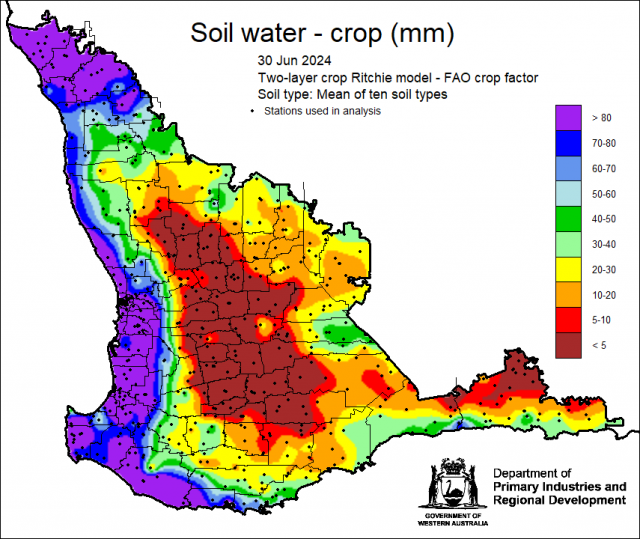
The latest DPIRD plant available soil water map is using the Food and Agriculture Organization of the United Nations (FAO) crop factor method.
This method assumes that post-germination, there are four stages of crop growth. On any day during the crop lifecycle, the crop coefficient for the crop’s growth stage is multiplied by the potential evaporation to give an estimate of plant evapotranspiration. Coefficients have been selected to suit WA wheat cropping.
The mean of ten different soil types is mapped, indicating that there is low soil water storage for the majority of the South West Land Division, with higher amounts along the coast and the northern grainbelt.

