Introduction to Carbon Calculators
Farm baseline accounts include all emissions on farm, emissions from purchases and inputs such as fertiliser, feed, and electricity. These are classified as Scope 1, 2 and 3.
- Scope 1: All emissions on-farm from agricultural activity
- Scope 2: Emissions from the production of purchased electricity
- Scope 3: All emissions associated with producing inputs such as fertilisers, herbicides, veterinary services etc.
It is best for individual farmers or consultants to go through the process of developing a baseline carbon account for their own individual farms to tailor the inputs to that specific enterprise. The quality of the results is dependent on the quality and detail of the data used, so accurate farm records are important.
The calculator used for these examples is the Greenhouse Accounting Framework (GAF). Using the Cropping GHG Accounting Framework (G-GAF), the Sheep & Beef GHG Accounting Framework (SB-GAF), and the Dairy GHG Accounting Framework (D-GAF). These tools were developed and maintained by Primary Industries Climate Challenge Centre and the University of Melbourne.
These calculators use MS Excel spreadsheets and are freely available to download. The tools also align with the Australian National Greenhouse Gas Inventory (NGGI) method. They are simple, intuitive to use and utilise data that should be readily available for a farmer. These tools provide a snapshot of a single years GHG emissions, they report the emissions as carbon equivalents (CO2 -e) of Carbon Dioxide (CO2), Methane (CH4) and Nitrous Oxide (N2O).
For mixed farms the spreadsheets do require combining the livestock and cropping calculators results outside of the calculators themselves.
The tools are freely available to run your own farm here.
Carbon Calculators – Western Australian grain and mixed farm examples
The carbon accounts of four example farm enterprises in the WA agricultural region were calculated using a tool designed specifically for Australian producers. The example farms were:
-
Eastern Wheatbelt 100% cropping enterprise
-
Eastern Wheatbelt mixed grain and sheep enterprise
-
Geraldton Medium Rainfall 100% cropping enterprise
-
Woolbelt mixed sheep and grain enterprise
The data for these examples has been established using the 2019 Planfarm Benchmarks, along with expertise and advice from local agronomists and other industry professionals.
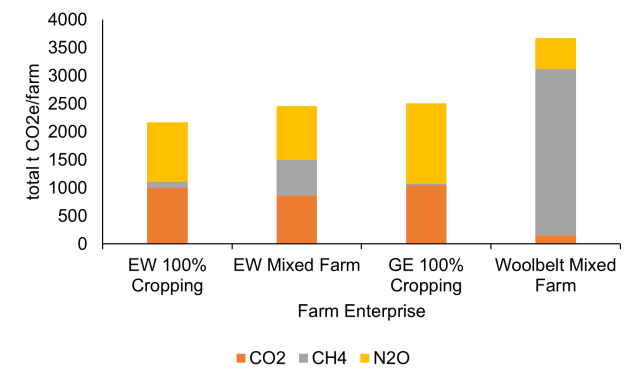
Comparing different farms, farm emissions as well as the composition of those emissions can vary greatly. While the Woolbelt mixed farm was the smallest in hectares, it had the largest number of livestock in the system, and the livestock have largely contributed to the farms total emissions compared to the other farm examples. The Eastern Wheatbelt (EW) 100% cropping farm had the lowest total emissions, as it was the farm with the lowest intensity of fertiliser and had no livestock (Figure 1).
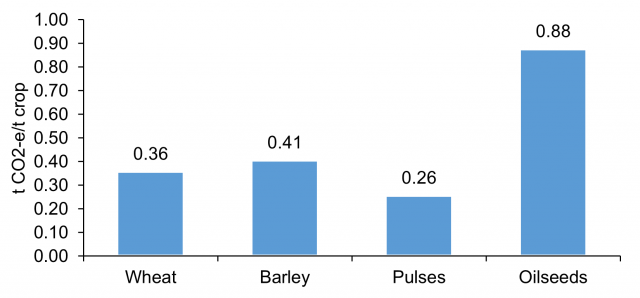
The emission intensity remained similar between cropping systems however it was higher in the Geraldton (GE) 100% cropping example (table 1).
| Wheat | Barley | Pulses | Oilseeds | Sheep Meat | Sheep Wool | |
|---|---|---|---|---|---|---|
| t CO2-e/t crop | t CO2-e/t crop | t CO2-e/t crop | t CO2-e/t crop | kg CO2-e / kg LW | kg CO2-e / kg greasy | |
| EW 100% Cropping | 0.29 | 0.31 | 0.24 | 0.70 | ||
| EW Mixed Farm | 0.29 | 0.31 | 0.24 | 0.70 | 8.10 | 29.40 |
| GE 100% Cropping | 0.36 | 0.41 | 0.26 | 0.88 | ||
| Woolbelt Mixed Farm | 0.29 | 0.31 | 7.63 | 28.54 |
These farm examples provide some ballpark emission figures and compositions for different farm enterprises and locations. They are jumping off points for producers to then go and utilise their own farm and its systems to investigate their own carbon emissions.
More detail of the farm examples and emissions following.
Eastern Wheatbelt
The Eastern Wheatbelt of WA is characterised by low rainfall, low input farming. These farms are generally larger in hectares and have a larger cropping enterprise compared to livestock, with some farms out of livestock completely. Average annual rainfall is 290mm, with 154mm average growing season (April to September). Farm sizes generally range from 4000 to 6000ha arable land. The most common crops grown are wheat, barley, canola with some pulses and legumes also grown.

Eastern Wheatbelt 100% cropping
The 100% cropping example is in the agro-ecological zone L3, near Merredin (Figure 2). It is in a low rainfall (154mm growing season) region and the farm has 4900ha of arable land. Approximately 70% of the annual rotation is sown to cereals (wheat and barley), 20% to oilseeds (canola) and 10% to pulses. The input summary outlines the key inputs used for the carbon calculations (table 2).
| Input Summary |
| Wheat | Barley | Pulse | Oilseed |
| Average grain yield (t/ha) | 1.50 | 1.60 | 1.20 | 0.75 | |
| Area sown (ha/farm) | 2500 | 900 | 500 | 1000 | |
| Nitrogen Fertiliser Use (kg N/ha) | 33 | 33 | 0 | 33 | |
| Urea Application (included in the above) (kg Urea/ha) | 25 | 25 | 0 | 25 | |
| Mass of Lime Applied (kg/ha) | 1000 | 1000 | 0 | 0 | |
| Fraction of the annual production of crop that is burnt (F) (ha/total crop ha) | 0.05 | 1.00 | 0 | 1.00 | |
| Herbicide/Pesticide use (kg total) | 7715 | 2777 | 2461 | 5375 | |
| Single Superphosphate (kg/ha) | 87 | 87 | 87 | 87 | |
| Annual Diesel Consumption (L/year) | 55646 | 20032 | 11129 | 22259 |
In this 100% cropping example fertiliser and fuel were two of the largest scope 1 emission contributors (figure 3, see appendix A).
The net farm emissions totalled 2184 t CO2-e/farm. Most of the emissions produced by the wheat crop enterprise, which is to be expected as it is the largest proportion of crop grown (figure 4).
The oilseed (canola) crops had the highest emission intensity, whereas the other crops were all reasonably comparable (figure 5).
The CO2-e (CO2 equivalent) emissions were heavily weighted toward carbon dioxide (49%), and nitrous oxide (46%), with very little methane (5%) emissions (figure 6). This is to be expected when sheep are not part of the business.
Eastern Wheatbelt mixed farm
The Eastern Wheatbelt mixed farm example has been based in the same zone as the 100% cropping example (L3, figure 2), with the same low rainfall restraint. The farm has 5000ha of arable land and is an 85% cropping 15% sheep enterprise (4200ha cropping, 800ha pasture). The farm runs a self-replacing merino ewe flock of 1200 ewes. Lambing occurs in June and lambs are turned off before harvest. The farm achieves a 90% lambing rate, and no crop grazing occurs. Pastures are low/no input and often used as breaks or fallows for the cropping rotations, improved pastures are not commonly grown.
The crop proportions are the same as used in the Eastern Wheatbelt 100% cropping, just at reduced hectares to allow for the pasture phase (table 3).
| Input Summary |
| Wheat | Barley | Pulse | Oilseed |
| Average grain yield (t/ha) | 1.50 | 1.60 | 1.20 | 0.75 | |
| Area sown (ha/farm) | 2200 | 750 | 400 | 850 | |
| Nitrogen Fertiliser Use (kg N/ha) | 30 | 30 | 0 | 30 | |
| Urea Application (included in the above) (kg Urea/ha) | 25 | 25 | 0 | 25 | |
| Mass of Lime Applied (kg/ha) | 1000 | 1000 | 0 | 0 | |
| Fraction of the annual production of crop that is burnt (F) (ha/total crop ha) | 0.05 | 1.00 | 0.00 | 1.00 | |
| Herbicide/Pesticide use (kg total) | 7715 | 2777 | 2461 | 5375 | |
| Single Superphosphate (kg/ha) | 87 | 87 | 87 | 87 | |
| Annual Diesel Consumption (L/year) | 55646 | 20033 | 11129 | 22259 |
The largest contributor to emissions in this mixed system was enteric methane (21%) and fertilisers (N2O fertiliser 18%, scope 3 fertilisers 18%) (see appendix A).
The net farm emissions totalled 2480 t CO2-e/farm. With largest proportion of the emissions coming from the wheat crops, followed by the sheep (figure 7).
The emission intensities for the cropping enterprise were the same as the 100% cropping Eastern Wheatbelt farm (figure 5). The sheep aspect of the enterprise observed an emission intensity of 8.10 kg CO2-e/ kg for meat and 29.40 kg CO2-e/ kg greasy for wool (see appendix A).
As to be expected the sheep enterprise contributed largely to the total methane CO2-e emissions compared to cropping and contributed little to the carbon dioxide and nitrous oxide emissions. Overall, 39% of the emissions were from carbon dioxide, 35% from nitrous oxides and 26% from methane (figure 8).
The GAF tools used for these calculations are freely available here to run your own farm.
Geraldton medium rainfall region
The Geraldton region covers high rainfall regions (500mm) close to the coast to low rainfall regions (250-300mm) towards the eastern and northern margins. These farms are generally larger, have both 100% cropping and mixed enterprises. Livestock numbers are generally found in higher numbers in the Dalwallinu and Northampton shires. Wheat is the primary crop produced, other key crops include lupins, barley, and canola.
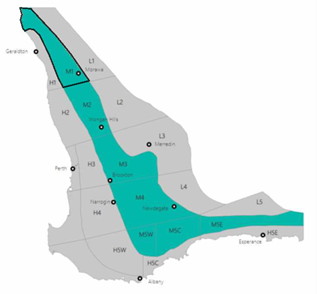
This example farm has been situated in the medium rainfall area, in the agro-ecological zone M1 (figure 9). The annual rainfall can vary between 325 and 450mm. This example has a 227mm growing season rainfall (April to September), it is a sole cropping enterprise with no livestock, and has 5450ha of arable land. 67% is sown to cereals (wheat and barley), 15% to pulses (lupins), and 18% to oilseeds (canola).
The input summary outlines the key inputs used for the carbon calculations (table 4).
| Input Summary |
| Wheat | Barley | Pulse | Oilseed |
| Average grain yield (t/ha) | 1.40 | 1.20 | 0.90 | 0.60 | |
| Area sown (ha/farm) | 3000 | 650 | 800 | 1000 | |
| Nitrogen Fertiliser Use (kg N/ha) | 54 | 54 | 0 | 54 | |
| Urea Application (included in the above) (kg Urea/ha) | 44 | 44 | 0 | 44 | |
| Mass of Lime Applied (kg/ha) | 250 | 0 | 0 | 250 | |
| Fraction of the annual production of crop that is burnt (F) (ha/total crop ha) | 0 | 0 | 0 | 0 | |
| Herbicide/Pesticide use (kg total) | 9258 | 2006 | 3937 | 5375 | |
| Single Superphosphate (kg/ha) | 24.3 | 24.3 | 24.3 | 24.3 | |
| Annual Diesel Consumption (L/year) | 66776 | 14468 | 17807 | 22259 |
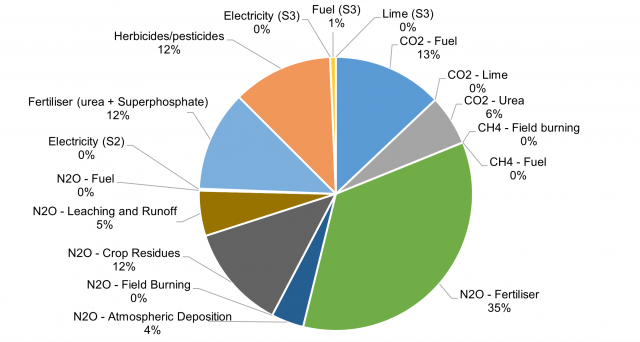
In this farm example, nitrous oxide fertiliser emissions were the largest contributor to CO2-eemissions (35%), followed by carbon dioxide from fuel (13%) (figure 10, see appendix B).
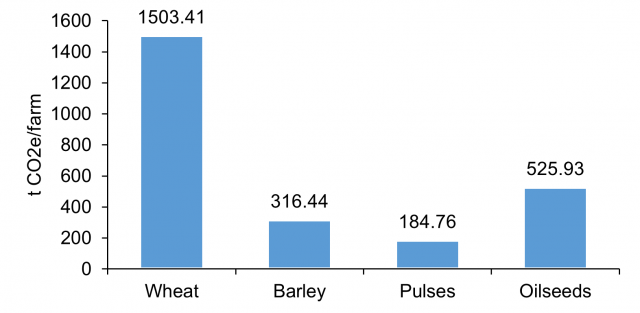
Net farm emissions totalled 2531 t CO2-e/farm. With the largest proportion of emissions coming from Wheat (figure 11).
The oilseed (canola) crops had the highest emission intensity, the wheat and barley crops had similar emission intensities and the pulses had the lowest (figure 12).
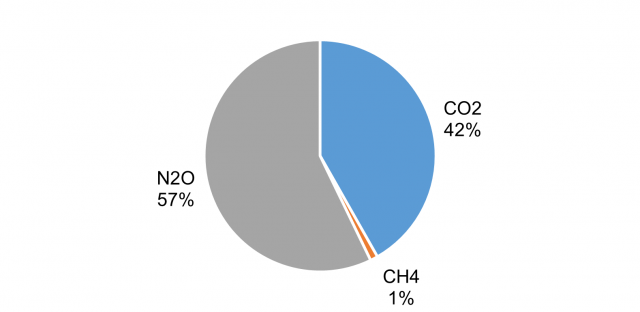
The CO2-eemissions were weighted toward carbon dioxide (57%), and nitrous oxide (47%), with very little Methane (1%) emissions (figure 13). This is to be expected when no sheep are present on farm.
The GAF tools used for these calculations are freely available here to run your own farm.
Central Woolbelt
The Central Woolbelt covers both medium and high rainfall zones the South West Australian agricultural region. These farms are generally moderate in size, ranging from 3000ha to 4500ha in size and have a larger livestock enterprise, predominantly sheep. Large proportions of farms are also suitable for cropping.
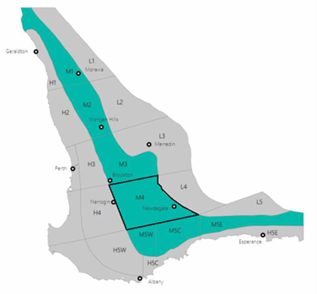
The Central Woolbelt mixed farm example has been based in the agro-ecological zone M4 (figure 14). This zone has annual rainfall averages 385mm. The year of this example experienced 199mm of growing season rainfall (April to September). This farm has 3000ha of arable land available, and 40% of the land is used for the cropping enterprise and 60% for the livestock, sheep enterprise.
The sheep enterprise is a self-replacing merino ewe flock of 6000 ewes. Lambing is in June and the farm achieves a 100% lambing rate. No crops are grazed, and pastures are improved, and legume based. Crops grown are wheat and barley (table 5).
| Input Summary |
| Wheat | Barley |
| Average grain yield (t/ha) | 1.95 | 2.23 | |
| Area sown (ha/farm) | 400 | 600 | |
| Nitrogen Fertiliser Use (kg N/ha) | 30 | 30 | |
| Urea Application (included in the above) (kg Urea/ha) | 25 | 25 | |
| Mass of Lime Applied (kg/ha) | 0 | 0 | |
| Fraction of the annual production of crop that is burnt (F) (ha/total crop ha) | 0.05 | 1.00 | |
| Herbicide/Pesticide use (kg total) | 1234 | 1851 | |
| Single Superphosphate (kg/ha) | 8.75 | 8.75 | |
| Annual Diesel Consumption (L/year) | 7733 | 11600 |
In this example with a larger sheep enterprise and higher sheep numbers, the main emission contributor is enteric methane (75%) (see appendix C).
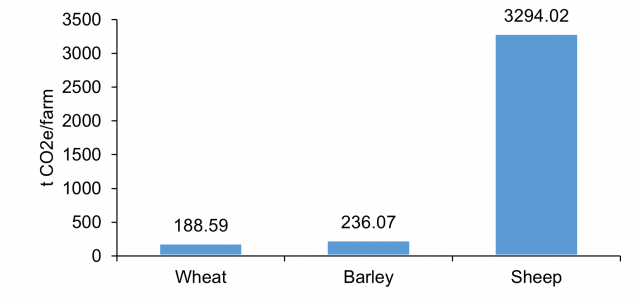
Net farm emissions were 3719 t CO2-e/farm. Most of the emissions were observed from the sheep, with wheat and barley contributing very little in comparison (figure 15).
The emission intensities for the wheat and barley were similar to those observed in the Eastern Wheatbelt examples (wheat 0.29 t CO2-e/t crop, barley 0.31 t CO2-e /t crop). The sheep enterprises had an emission intensity of 7.63 kg CO2-e / kg LW for meat and 28.54 kg CO2-e / kg greasy for wool.
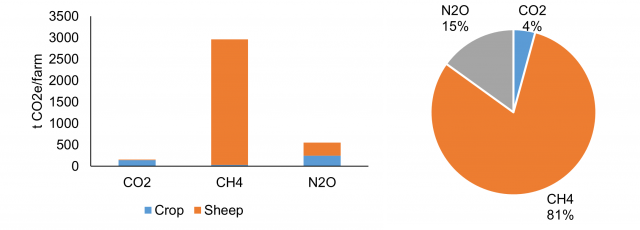
Farm methane was the major contributor to emissions with 81% of carbon equivalents coming from methane. 15% was contributed from nitrous oxides and 4% from carbon dioxides (figure 16).
The GAF tools used for these calculations are freely available here to run your own farm.
Carbon Calculators – Western Australian Dairy farm example
Summary
A carbon account of an example Western Australian dairy farm was established using the D-GAF tool to assess the emissions from this farm. The data for this example was established from industry professional consultation . The example dairy farm is a 415 milking cow operation, producing on average 22 L/day/head. This is a non-irrigated production system, with 350 ha of improved pasture. Fertiliser applications included a total of 89 tonnes of Urea, and a total of 141 kg N/ha applied. 175 tonnes of lime was also applied.
Table 1 – Livestock numbers, weights and milk production
|
| Milking Cows | Heifers >1 | Heifers <1 | Dairy Bulls>1 | Dairy Bulls<1 |
|
| Livestock Numbers | 415 | 60 | 120 | 0 | 5 | head |
| Liveweight | 600 | 420 | 180 | 0 | 750 | kg/head |
| Milk Production | 22.3 | NA | NA | NA | NA | L/day/head |
Carbon Account Results
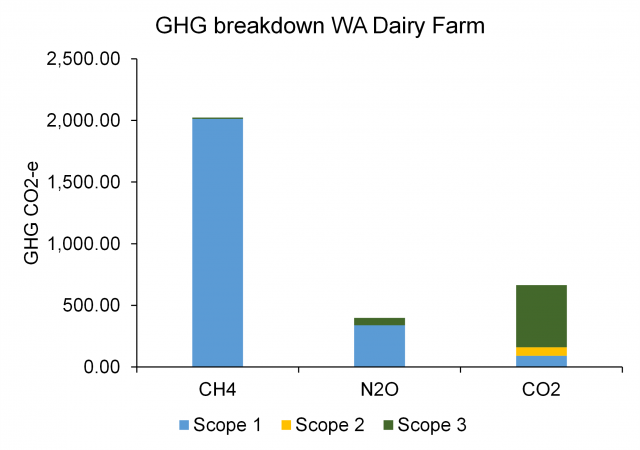
The largest percentage of CO2-eproduced was from enteric methane (60%), followed by the collective pre-farm scope 3 emissions (15%) then manure (12%). The emissions intensity for milk solids was 13.87 t CO2-e/t MS/farm/year. The lowest contributing factors included electricity, fuel, herbicides and pesticides, and atmospheric deposition (1-2%) (figure 1). Most emissions emitted were methane, followed by carbon dioxide and nitrous oxide. The methane and nitrous oxide were predominantly produced from scope 1 emissions, where the carbon dioxide emissions were mainly produced from scope 3 emissions (figure 2).
Enteric methane was the largest contributor to total farm emissions (60%). The largest factor influencing the production of methane is animal numbers, as numbers increase, particularly milking cows, the enteric methane will also increase. The amount of feed consumed influences the methane produced. Milking cows produced the largest daily methane yield (0.412-0.444 kg CH4/head/day), followed by the dairy bulls <1 year (0.236 kg CH4/head/day). The increase in methane produced by the milking cows, also aligned with the increase in feed consumption and milk production seen in spring. As liveweight increases there is also an increase methane produced by the animal.
Carbon sources of emissions such as lime, fuel and urea were reasonably small contributors to total emissions. Lime contributed 3% to the overall emissions, currently a small contributor due to the quantity of lime applied (figure 1). If the amount of lime needed increased, this would also be reflected in the emissions. Fuel and urea contributed to 2% of emissions independently. 7% of emissions emitted were due to fertiliser applications, including both nitrogen fertilisers and urea (figure 1). However, of the scope 1 fertiliser emission outputs, urea CO2 contributed 20% more t CO2-e/farm compared to direct fertiliser N2O emissions.
Two of the key influences on emissions from agricultural soils include leaching and runoff, and urine and dug deposited during grazing. Leaching and runoff contributed to 4% of the total emissions (figure 1). This is the leaching of organic nitrogen, and subsequent denitrification in rivers and estuaries. Leaching of nitrogen in soils includes both leaching of nitrogen from manure and fertiliser. In this example the emissions have been produced predominantly from fertilisers.
Manure represents 12% of the total emissions produced. Most of these emissions are present as methane from manure management strategies. While the anaerobic lagoon contributed to a smaller fraction of the manure management strategies implemented (table 2), the methane produced was much higher compared to the other manure management strategies. Urine and dung nitrous oxide emissions which were deposited during grazing contributed to almost a quarter of the total t CO2-e/farm manure emissions.
Table 2 – Manure management
|
| Pasture | Anaerobic Lagoon | Sump and Dispersal | Drain to Paddocks | Solid Storage |
|
| Manure management for milking cows | 87.5 | 7.5 | 2.5 | 0 | 2.5 | % of all excreta |
| Manure management for other dairy cows | 100 | 0 | 0 | 0 | 0 | % of all excreta |
Options to reduce emissions in Dairy:
The largest challenge now is reducing the enteric methane emitted from the animal directly. The key ways to do this currently include improving livestock efficiencies, and reducing the emissions intensity. Other options such as feed supplements are potentially effective ways to reduce methane emitted by the animal, however these are not currently on the market, and will require extra expense for the farmer.
Animal genetics are the longest lasting and permanent options for reducing enteric methane. Changing genetics requires further research and it will take longer time periods to achieve.
The other large on farm emission is around manure management. These emissions are primarily from methane, but also include nitrous oxide. Measures to reduce GHG emissions from manure include stockpile aeration and composting which reducing methane emissions or adding urease inhibitors to manure stockpiles can reduce nitrous oxide emissions; urease inhibitors are chemical additives that stop or reduce the rate that urea is converted to nitrous oxide.
To reduce emissions from livestock urine some options include breeding for improved nitrogen efficiency, using forages with higher energy-to-protein ratios, and balancing high protein forages with high energy supplements.
There are a few other options to reduce, sequester or mitigate carbon emissions. These include, but are not limited to:
- Sequester carbon by planting trees or encouraging remnant vegetation regrowth
- Shift to renewable alternative energy sources
- Reduce inputs
- Improve livestock efficiencies by changing feed regimes, feed efficiencies such as increasing the improving the use of legumes in the system.
- Use improved genetics to produce less methane,
- Feed animals supplements that will mitigate methane mitigation
- Prevent soil erosion by wind and water, and general improvement of soil characteristics (claying and liming)

