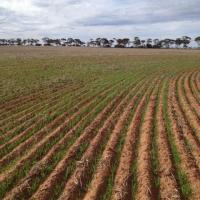
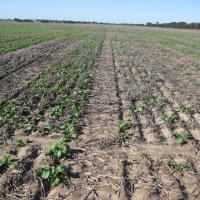
Why measure seedling numbers?
Many factors influence seedling number and crop establishment, including:
- soil conditions at sowing,
- non wetting,
- the sowing operation and
- seed rate and quality.
The final crop yield obtained is directly influenced by the efficiency of crop establishment. Without the plant numbers, it is not possible to achieve full crop yield potential, no matter how good your fertiliser or weed management programs may be.
Procedure for measuring seedling number
1. Using a 50 cm ruler, place it at random between two rows of crop.
2. Count and record the number of crop plants along each row on both sides of the ruler.
This figure is referred to as the total plant number per metre row of crop.
3. Repeat measurements for a total of ten sites along the monitoring path.
4. Add up to ten recordings, and calculate the average of the ten measurements.
To convert from plants per meter of row to plants per square metre:
Plants per square metre = ave plant no per metre of row X 100
row spacing (cm)
For example:
200 plants/m² = 30 (plants/m) X 100
15 cm
Interpreting your results
The following table lists the desirable plant establishment numbers according to rainfall zone and crop species.
| Crop type | Average annual rainfall (mm) | ||
| 250 - 350 | 350 - 450 | 450 - 550 | |
| Wheat | 150 - 160 | 160 - 190 | 190 - 210 |
| Barley | 130 - 160 | 160 - 180 | 160 - 180 |
| Oats | 130 - 150 | 150 - 180 | 180 - 200 |
| Triticale | 160 - 180 | 180 - 200 | 200 - 220 |
| Canola | 40 - 70 | 50 - 80 | 50 - 80 |
| Lupins | 45 | 45 | 35 - 45 |
| Peas | 35 - 50 | 75 - 95 | 75 - 9 |
Rule of thumb: For cereals with seed at 36 mg and sowing rate 60 kg/ha an achieved density of 100 plants/m2 is only 60 per cent establishment rate.
Measure at the right time
Table below provides a guide to the number of days after seeding in which you would expect emergence based on average temperature and depth of sowing. This information will help identify the best time to monitor seedling number.
| Average temperature (ºC) | Example sowing | Days to emergence Depth of seed placement (cm) | |||
| 3.0 | 5.0 | 10.0 | 15.0 | ||
| 20 | April sowing Mingenew | 5.1 | 60 | 8.8 | 10.7 |
| 15 | May sowing - Moora | 6.9 | 8.2 | 11.4 | 14.6 |
| 12.5 | June sowing - Cunderdin | 8.5 | 10.0 | 13.8 | 17.6 |
| 10 | June sowing - Kondinin | 11.0 | 12.9 | 17.7 | 21.5 |
| 7.5 | July sowing - cold snap | 17.7 | 20.3 | 26.6 | 33.1 |
Average temperature is daily max + min divided by 2.


