Sheep industry turn-off update
Kate Pritchett (DPIRD, WA)
Author correspondence: kate.pritchett@dpird.wa.gov.au
Domestic slaughter
In 2024, Western Australia's (WA) total sheep slaughter was 7% higher than 2023, an already elevated year.
Adult sheep slaughter totalled 2.1 million head, a year-on-year (YOY) increase of 12%. This is largely due to many producers choosing to reduce stock numbers in response to lower prices, poor seasonal conditions early in the year and uncertainty around the live export industry.
Lamb slaughter reached 3.1 million head, a YOY increase of 4% and the highest on record.
| Livestock slaughtered | Year | |||
|---|---|---|---|---|
| 2022 | 2023 | 2024 | YOY change | |
| Sheep | 1,180.9 | 1,906.6 | 2,134.6 | 12% |
| Lambs | 2,574.7 | 2,973.7 | 3,103.8 | 4% |
| Total | 3,755.6 | 4,880.3 | 5,238.4 | 7% |
Sheep slaughter has been elevated for the last 2 calendar years as seen in the graph below. These sorts of numbers haven’t been seen since the early to mid-2000s when the state flock was significantly larger, and are likely indicative of widespread destocking.
Lamb slaughter reached record highs in 2024 totalling 3.1 million. This follows high levels of slaughter in 2023 which may indicate a reduced availability of replacement ewes in the coming years.
Live export (by sea and air)
In 2024 WA live sheep exports totalled 423,300, down 37% compared to 2023 (Table 2). This has been due to reduced numbers heading to Kuwait and Israel; however Saudi Arabia re-entered the market, increasing their imports to 122,500 in 2024.There was also strong growth in the Jordanian market, increasing 248% YOY from 36,500 in 2023 to 127,000 in 2024. After a relatively strong first quarter in 2024, live exports slowed until the mid-year trade pause beginning in June. Trade resumed in September to reach 423,300 by year end (Figure 3).
| Livestock type | Year | ||||
|---|---|---|---|---|---|
| 2022 | 2023 | 2024 | YOY change | ||
| Sheep | 0.52 | 0.67 | 0.42 | - 37% | |
Interstate transfers
The interstate sale of sheep from WA in 2024 was the third highest on record behind 2010 and 2020.
A total of 884,000 sheep and lambs were trucked east over the course of the calendar year, a sizeable increase on the 249,000 in 2023 (Table 3).
In 2024, more sheep were sold interstate than via live exports, which has only occurred twice previously; in 2020 and 2021. Interstate sales started the year very strongly. In the first 5 months of 2024, a total of 674,000 sheep and lambs were trucked east from WA. Numbers plateaued during the middle of the year before lifting again in spring to close the year out at 884,000 head (Figure 4).
This was largely driven by a strong price difference between the eastern states and WA, with WA at a sizeable discount for a portion of the year.
| Livestock type
| Year | ||||
|---|---|---|---|---|---|
| 2022 | 2023 | 2024 | YOY change | ||
| Sheep | 121 | 88 | 408 | 362% | |
| Lambs | 247 | 161 | 476 | 196% | |
| Total | 368 | 249 | 884 | 255% | |
Total sheep turn-off
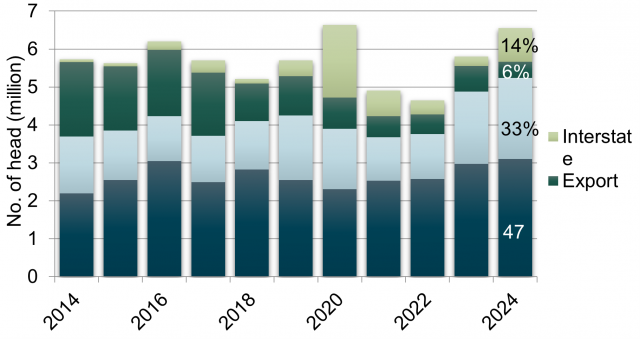
In 2023 WA's total sheep turn-off reached 5.8 million, up 25% YOY from 4.65 million in 2022. This increased a further 13% in 2024 reaching 6.55 million, just slightly behind the 6.63 million in 2020.
Almost half, 47% (3.1 million) was made up of lamb slaughter, the highest on record.
Sheep slaughter reached 2.13 million and accounted for 33% of turn-off. This was the highest since 2008.
Live export was 0.42 million or 6% and interstate transfers totalled 0.88 million, 14% of turn-off (Figure 5).
| Turn-off | Year | |||
|---|---|---|---|---|
| 2022 | 2023 | 2024 | YOY Change | |
| Lamb slaughter | 2.57 | 2.97 | 3.10 | 4% |
| Sheep slaughter | 1.18 | 1.91 | 2.13 | 12% |
| Live export | 0.52 | 0.67 | 0.42 | -37% |
| Interstate transfer | 0.37 | 0.25 | 0.88 | 255% |
| Total | 4.65 | 5.80 | 6.55 | 13% |

Impact on the WA sheep flock
The WA sheep flock numbered 12.4 million as of July 2022 according to the ABS.
Industry confidence is low due to tough seasonal conditions, poor prices, and changes in government policy. This has led to very high rates of turn-off as producers reduce the size of their sheep enterprise. This has likely resulted in significant flock decline between 2022 and 2024 and will likely continue into 2025 unless the rate of sales slows significantly, and seasonal conditions are favourable. It is expected that the flock may have numbered around 9.5 million as of July 2024.
If current levels of turn-off are sustained for the remainder of 2024-25 the flock may decline further to between 8 and 8.5 million. However, if ewe joining rates and lamb marking are lower than expected the flock will reduce even further.
For further information contact:
Kate Pritchett, Senior Research Scientist, Livestock.


