Seasonal rainfall update

Rainfall update 13 June 2018

The second week of June has provided follow-up rainfall for northern cropping areas, as well as western parts of the central cropping area. Far eastern and south-eastern parts of the grainbelt received lighter falls, as expected from the wind pattern. Deep low-pressure systems generated strong north-westerly winds. The week also brought winter-season rain to the Pilbara region from a cloud band.

Rainfall totals in the past week
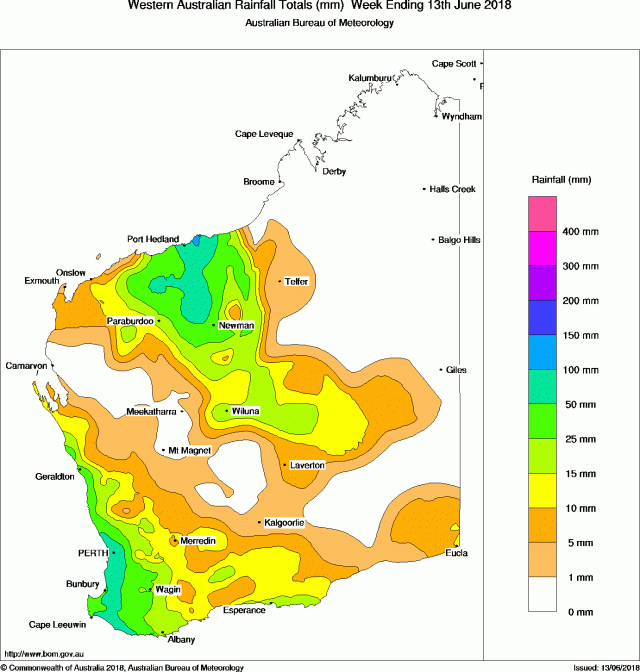
Map of Western Australia showing coloured areas of rainfall levels in millimetres
Figure 1 Western Australian rainfall totals (in millimetres) for the week ending 13 June 2018 (source: Bureau of Meteorology, www.bom.gov.au/climate/)

For more information refer to the Bureau of Meteorology's weekly rainfall table for the south-west.

Rainfall for the month to date

Western and southwestern locations have received good rainfall to date, though lighter falls have occurred over the south-eastern grainbelt. Gascoyne and Pilbara have had well above-average rainfall for the month to date, noting that this is a time of year when rainfall is usually low (Figure 2).
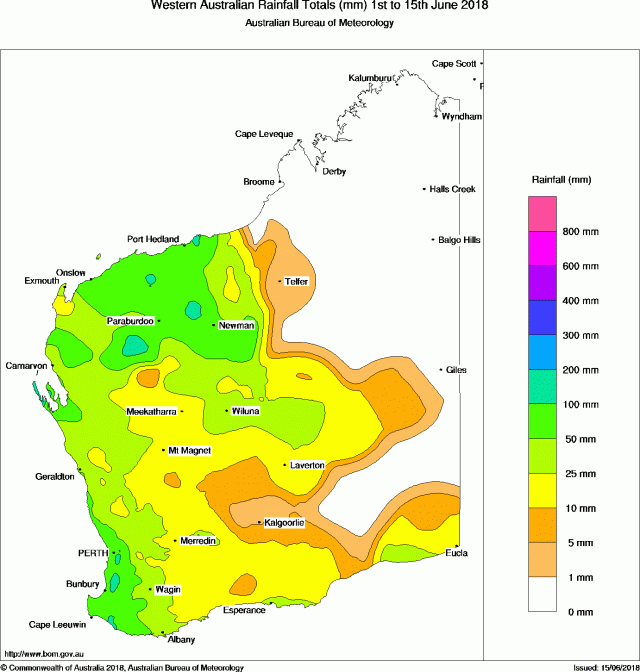
Map of Western Australia showing coloured areas of rainfall levels in millimetres for 1 to 15 June 2018
Figure 2 Western Australian rainfall totals (in millimetres) for 1–15 June 2018 . (source: Bureau of Meteorology, www.bom.gov.au/climate/

Monthly rainfall to date from DPIRD weather stations
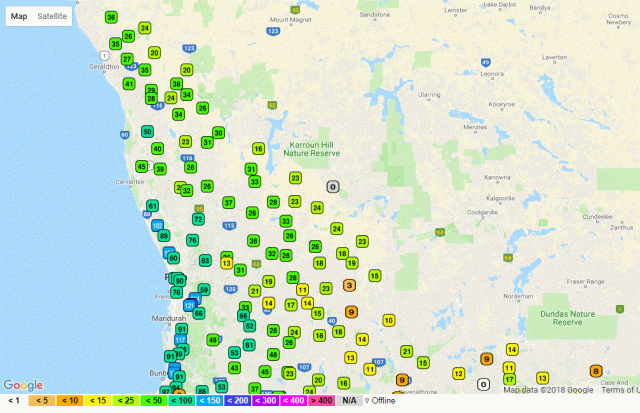
Map of the northern grainbelt with DPIRD weather stations marked with monthly rainfall to date
Figure 3 Monthly rainfall to date (in millimetres), 1–13 June 2018, from DPIRD weather stations in northern and central agricultural areas
Map of the southern grainbelt with DPIRD weather stations marked with monthly rainfall to date
Figure 4 Monthly rainfall to date (in millimetres), 1–13 June 2018, from DPIRD weather stations in southern agricultural areas

Seasonal rainfall to date

Map of Western Australia showing coloured areas of rainfall totals sice 1 April 2018, in millimetres
Figure 5 Seasonal rainfall in millimetres (mm) from 1 April to 12 June 2018 (data source: Patched point dataset)
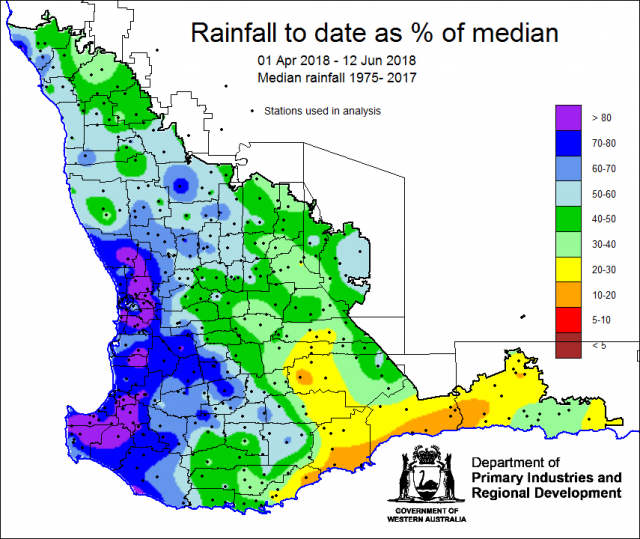
Map of Western Australia showing coloured areas of rainfall totals since 1 April 2018, in millimetres
Figure 6 Seasonal rainfall to date as a percentage of the median from 1 April to 12 June 2018 (data source: Patched point dataset)

Soil moisture

Soil water storage has improved in northern and western cropping areas, while far-eastern cropping and south coast regions still have low storage. Figure 7 shows the estimated root zone soil water storage from the Bureau of Meteorology landscape model, as relative storage for the time of the year.
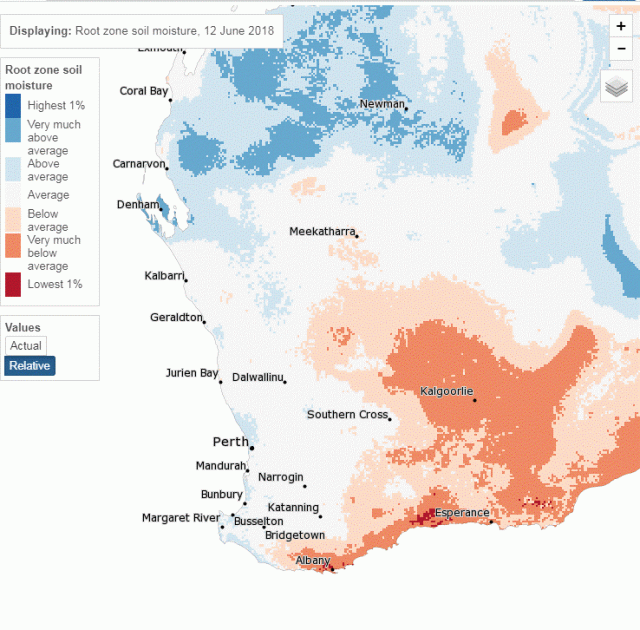
Map of root zone soil water shown as below average, average or above average for the time of the year.
Figure 7 Estimated root zone soil moisture 12 June 2018, relative to expected levels at this time of year (source: Bureau of Meteorology's landscape water balance model, www.bom.gov.au/water/landscape/)

Low levels of soil water remain in the eastern and south-eastern grainbelt. Figure 8 shows the estimated fallow soil water storage to 12 June 2018.
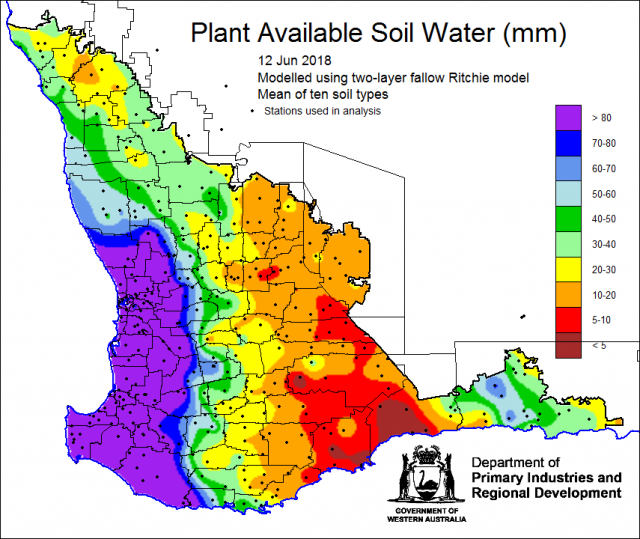
Map of soil water storage in millimetres at 12 June 2018
Figure 8 Estimated plant available soil water in millimetres (mm) as at 12 June 2018 (data source: Patched point dataset)

Rainfall forecast for the next week

Continuing rainfall is predicted for the week ending 20 June 2018 (Figure 9). A cold front is predicted to cross the WA coast on 18 and 19 June. A period of fine weather is expected after that. Note relatively lighter rainfall is predicted for eastern grainbelt and South Coast.

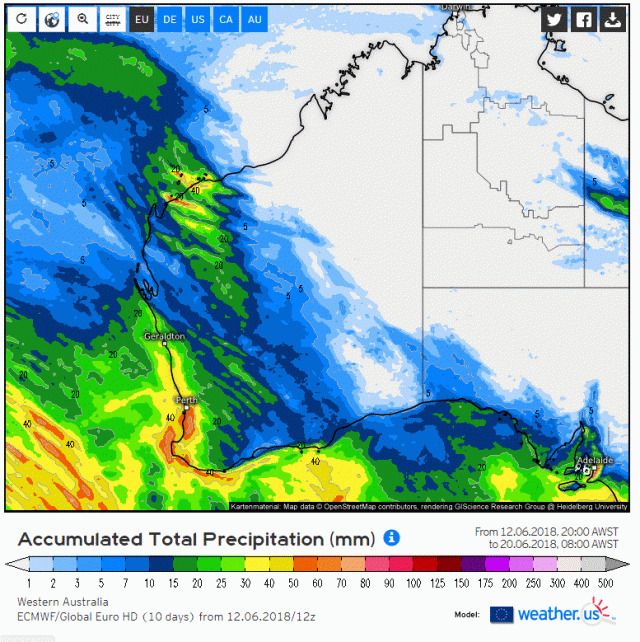
The ECMWF model is predicting a similar spatial pattern of rainfall over the coming week, with more rain for the Pilbara. Total predicted rainfall from the ECMWF model for the next 10 days is shown in Figure 10. 
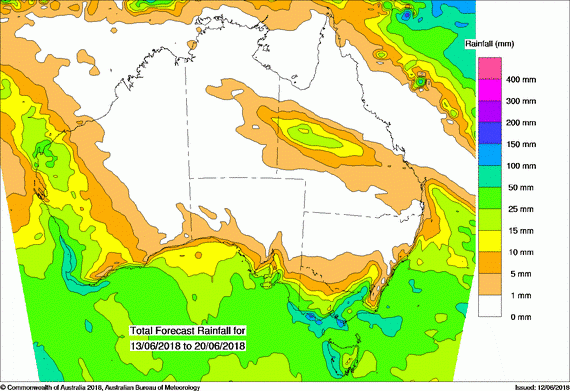
Map of rainfall forecast for the next week to 20 June 2018 in millimetres
Figure 9 Forecast rain in millimetres (mm) for 13–20 June 2018 (source: Bureau of Meteorology, www.bom.gov.au/jsp/watl/rainfall/pme.jsp).
Map of rainfall forecast for the next week to 20 June 2018 in millimetres from the ECMWF model
Figure 10 Total predicted accumulated rainfall from the ECMWF model for 12–20 June 2018 (source: https://weather.us/model-charts/euro/western-australia)