Introduction
Although drip irrigation can be a very efficient method of applying water and fertiliser to crops, the best irrigation system is only as efficient as its installation, maintenance and operation. An irrigation system should apply water evenly to the crop within a shift. This allows correct scheduling and is the first step in efficient irrigation.
Efficient irrigation scheduling on sandy soils is difficult and a systematic approach is needed to deliver water evenly to match plant demand without excess drainage and leaching.
Plant husbandry and irrigation delivery
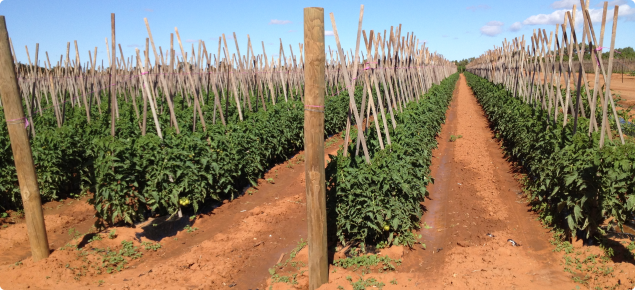
Typical plantings on the Swan Coastal Plain consist of double rows offset 50cm within and between rows. Plants are grown with two leaders trellised up stakes to a height of about 1.8m. Each double row is around 2m apart, giving an average of 20 000 plants per hectare.
Each row of plants has its own drip line. Drippers are spaced at 20–30cm and output ranges between 0.7 and 1.6 litres per hour. Drip line is often described by its flow per metre. A line with drippers spaced at 20cm and dripper output of 1 litre per hour would deliver 5L/m/hr. A tape with the same flow and drippers spaced at 25cm would only deliver 4L/m/hr.
To calculate output per metre, divide litres by the spacing of each dripper in metres and multiply by the output of each dripper.
Example 1
A drip line is spaced at 0.2m (20cm) and flow is 1.0L per dripper per hour.
Output per metre = litres/dripper spacing x dripper output per hour
1L/0.2 x 1.0 = 5.0L/m/hr
To assess actual emission rates and the evenness of irrigation delivery see ‘Measuring delivery of drip irrigation systems’.
Once you know your system is delivering water evenly, schedule irrigation to match crop requirements based on weather conditions and crop growth stage.
Plant water requirements
Water requirements change as plants grow larger, increase leaf area, mature and produce fruit. Matching irrigation to plant water demand minimises the risk of stress and yield losses. Use evaporation to match irrigation requirements to plant growth stage. The proportion of evaporation (Epan) required to meet plant water demand is called a crop factor (CF). If evapotranspiration (ET) is used, the proportion is called the crop coefficient (Kc).
Crop factors for irrigating tomatoes on sand have been developed and are shown in Table 1 for different growth stages.
| Crop stage | Crop factor | Root depth (mm) |
|---|---|---|
| Transplanting and establishment | 0.5 | 75 |
| First tie | 0.6 | 100 |
| Second tie | 0.9 | 200 |
| Third tie | 1.1 | 250 |
| Fourth tie | 1.3 | 300 |
| Fifth tie through harvest | 1.4 | 300 |
| Towards end of harvest | 1.2 | 300 |
To calculate daily water requirements, multiply evaporation by the crop factor for the stage of growth. The example below shows the calculation required for a plant at first tie on a day with 8.4mm evaporation.
Daily water requirements = Evaporation x crop factor
8.4 x 0.6 = 5.0mm
To calculate minutes required, divide the required amount by the application rate and multiply by 60.
Required amount/application rate x 60
5/5 x 60 = 1.0 x 60 = 60 minutes
For more information on using crop factors and evaporation to schedule irrigation, see ‘Evaporation-based irrigation scheduling’.
How the irrigation required is applied is determined by the individual farm soil water-holding capacity, water quality and the stage of the crop. Irrigation should meet the water-holding capacity for the rooting depth of the crop. Excess irrigation that leads to water passing through the root zone lowers irrigation efficiency. Fertilisers applied with water will drain through the profile, leaching nutrients so that extra water and nutrients need to be applied.
Most tomato roots will not exceed the depth of the rotary hoe. While some stabilisation roots are found beyond 30cm, most fibrous feeder roots are in the top 0–25cm. Scheduling irrigation to a depth of 30cm for mature plants reduces excess drainage and increases water and fertiliser use efficiency.
Use soil moisture monitoring equipment or dye run through the drippers to determine the volume of water reaching various depths.
This can help determine the length of individual irrigations and how many shifts per day should be applied. For the previous example, with the crop at first tie, the root zone is about 100mm which, from the dye test, required 0.3L to reach 100mm. If 1L is required for the day, either four 15 minute irrigations or three 20 minute irrigations would be appropriate.
See Using dye to show water movement in the soil below drip irrigation and Soil moisture monitoring to fine-tune irrigation scheduling for more information.
Time between irrigations is best determined by assessing the soil’s ability to hold the readily available water. Use soil moisture monitoring to confirm the effectiveness of irrigation when using any scheduling techniques. The movements of lines on soil moisture graphs show the time water takes to drain through the soil profile. By understanding these graphs you can tailor your irrigation to achieve little drainage — to retain nutrients within the root zone — or to confirm a leaching event to remove salts from the crop root zone.


