Leadership statement
A suitably skilled workforce is essential to optimise our contribution to economic development within Western Australia. Improving and maintaining the capacity and capability of our workforce is imperative to enabling innovation, strengthening competitiveness, boosting resilience and developing a larger capacity for the agriculture industry to capitalise on opportunities and contribute to global food security.
This workforce and diversity plan (the plan) builds upon the inaugural Workforce and diversity plan 2012–15 through a range of strategies and initiatives aimed at the further development of our people and their people management and leadership skills.
The plan outlines the strategies and initiatives, operationalised at the directorate level through their own workforce plans, to deliver a diverse, flexible, responsive and sustainable workforce capable of continuing to support a high quality agriculture and food industry to the people of Western Australia.
Workforce diversity is a key component of workforce planning and strategically links equal employment opportunity (EEO) initiatives with diversity groups under-represented in our workforce. These EEO initiatives are aligned to best practice workforce planning and benchmarking requirements and will support the achievement of corporate objectives and meeting legislative requirements.
Through our commitment to diversity we will ensure all policies and procedures reduce any barriers to substantive equality and participation at all levels.
The plan will be regularly reviewed to ensure progress towards goals and objectives are realised and options for further improvement identified.
I look forward to your support and contribution in developing, implementing and evaluating these initiatives.
Mark Webb
A/Director General
30 June 2016
Our department
Our vision
A progressive, innovative and profitable agriculture and food sector that benefits Western Australia.
Our purpose
To support the success of the agriculture and food sector to benefit Western Australia.
Our capability
We have a statewide network of dedicated and talented people able to address the economic, scientific, technological, environmental, managerial and social drivers that shape the agriculture and food sector. Our professionalism enables us to collaborate with a range of partners to develop and share expertise, knowledge and technology.
Our business
In leading the economic development of the agriculture and food sector in Western Australia, we support the success of the state’s agrifood businesses through services and partnerships that help drive the growth and transformation of industries. We also safeguard the state’s precious natural resources.
The statewide network of approximately 1100 employees in 35 regional locations, is structured around three directorates focused on major agrifood industry sectors – grains, livestock and irrigated agriculture. These are supported by two directorates addressing biosecurity and regulation and business support capabilities. Each industry sector has an industry development plan that determines directorate priorities and resource allocation. Operationally, staff from each directorate work together to provide the range of skills and perspectives needed to foster economic growth.
This industry-driven structure and approach aligns with the Western Australian government’s priority plan for agriculture and food and the four focus areas: growing markets, growing productivity, growing profitability and growing people.
These investment priorities are the foundation of the department’s Agrifood 2025+ strategic plan for 2014–17. The strategic plan, in turn, is backed by an operational plan which outlines activities and key deliverables designed to achieve outcomes linked to investment priorities. Outcomes are achieved through a project delivery model with funding provided from the state government, external funding bodies or a combination of both. Projects may be long or short term, wholly delivered by DAFWA and at other times involve collaborative partnerships. Government priorities, industry and clients are delivered through projects and the quality of project outcomes relies on our people’s performance.
Challenges and opportunities
The agrifood sector is constantly changing and evolving as are its needs and the opportunities presented. In the current economic environment, DAFWA remains focused on enabling the growth of the sector through strong and effective partnerships and collaboration with industry that continues to grow and mature.
This also includes creating an enabling environment using new business models that are sustainable and add value to all stages of integrated value chains.
The principles to achieve this as are contained in the Building the new DAFWA 2015–18 program and include:
- an increased focus on state economic development
- working primarily in areas directly related to core statutory obligation, government priorities and industry growth
- a focus on improved competitiveness and profitability for the whole supply chain
- facilitating industry to take a leadership role for commercial and private-benefit activities
- increasing co-design with, and co-investment from, industry and businesses
- organisational efficiency and agility through rationalisation of our organisational structures, sites and business processes.
The above principles will be supported by the following key workforce and diversity strategies:
- Building workforce capability and capacity with the flexibility and diversity to meet changing needs and deliver outcomes. Key skill areas are outlined in the Work function area of this plan.
- Managing the workforce composition within the complexity of the project delivery model including uncertainty regarding project futures and external funding.
- Recruitment and succession planning for an ageing workforce, including effective, targeted and sustainable recruitment, succession planning and providing work arrangements that support staff during all stages of life.
- Building workforce in regional locations through targeted attraction and retention strategies and the strategic relocation of metropolitan positions.
Key principles
Recognising that people are critical to success, the following principles are applied to support our staff build their capability and capacity.
oneDAFWA
oneDAFWA is designed to define the behaviours and values of our people to deliver a consistently high standard of value to stakeholders and each other.
Building and sustaining organisational performance
Deployment of the Australian Business Excellence Framework (ABEF) to support the ABEF categories most relevant to this plan: people and leadership.
Performance planning and development (MyPlan)
The My Job and Development Plan (referred to as MyPlan) is a performance planning and development process using a coaching approach. It is focused around people having conversations providing clarity in terms of work priorities, contribution to strategic goals, recognition and individual learning and development needs.
People leadership
The people leadership program facilitates building high-performing, customer-focused teams across the organisation by promoting and accommodating a strong leadership culture and capability. There are 195 people leaders who are supported to focus on an individual’s professional and career development to help meet longer-term workforce needs.
Workforce and succession planning
Planning to ensure staff are equipped to fill roles and positions as they become available.
Critical positions have been identified that are either integral to DAFWA mission critical functions or are high-priority positions to meet directorate objectives.
Succession planning for these positions are managed at the directorate level and integrated into directorate workforce plans.
Diversity
Facilitate suitable access to a diverse and talented pool of people to ensure future business success.
Staff engagement
A staff engagement survey is conducted periodically to measure our people’s connection and commitment. The surveys help determine the extent to which we have the ‘right’ elements of culture in place to build engagement with staff and clients.
Homebase
Homebase is the mechanism for assigning people to projects based upon staff availability for reassignment and project opportunities as they arise.
Quality of Life initiative
The Quality of Life initiative is about providing a working environment that is supportive and conducive to our people’s quality of life.
Workforce planning
This section of the plan provides information on the department’s workforce profile and outlines the key strategies and initiatives needed to meet existing and future workforce needs. Data is as at December 2015 unless otherwise stated.
Workforce profile
Location
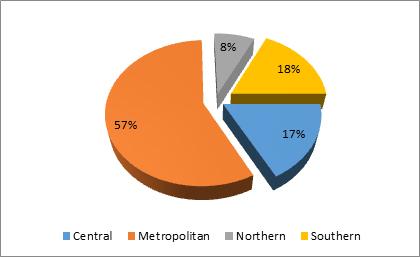
Nearly half (43%) of staff are located in regional locations. This compares to only 24.6%1 across the public sector.
Figure 1: Workforce by region
Key issues and opportunities:
- The state government’s focus on regional development, particularly through the Royalties for Regions initiative, will over time see an increase in the percentage of regionally based public sector employees.
- The challenge is to maintain and grow this proportion of regionally based staff (target is 50%) and requires initiatives to address staff attraction, recruitment and retention through considering whether services traditionally delivered from South Perth can be relocated to regional locations, particularly when considering the filling of vacant positions.
- Meeting the strategic objective of relocating identified metropolitan positions to regional locations is to be achieved by December 2016.
1 Data based on Quarterly Entity Profile Sept 2015.
Skill and capability
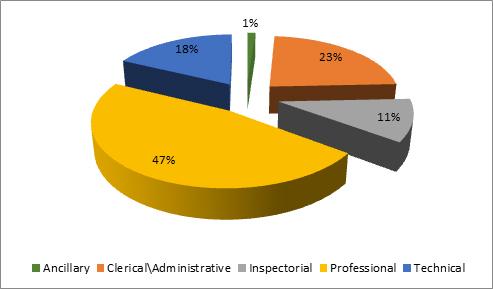
The workforce is categorised by work function with the majority undertaking professional duties.
Figure 2: Work function profile
Further analysis by position title identifies the main skill areas of technical and professional (research).
Table 1: Skill areas by position title
| Skill areas by position title | Percentage |
|---|---|
| Technical | 17.6% |
| Professional (research) | 17.2% |
| Professional (development) | 9.4% |
| Professional (biosecurity) | 3.6% |
| Inspectorial | 10.9% |
| Management | 10.9% |
| Clerical/administrative (ex-administrative officer) | 10.7% |
| Administrative officer | 7.2% |
| Project management | 4.4% |
| Policy | 3.6% |
| Client engagement, marketing and communications | 2.2% |
| Economist | 1.2% |
| Ancillary (agricultural operative) | 0.6% |
| Ancillary (cleaner/other) | 0.2% |
| Market analyst | 0.2% |
There is ongoing commitment to building staff leadership and management capabilities; in particular people leaders and project managers. More recently, there has been a focus on building agricultural emergency response capabilities.
Table 2: Staff who have participated in a leadership or management training course
| Skill areas by position title | People leaders (no.) | People leaders (%) | Project managers (no.) | Project managers (%) | All staff (no.) | All staff (%) |
|---|---|---|---|---|---|---|
| Leadership and management | 178 | 85% | 131 | 73% | 480 | 46% |
| Project management | 157 | 75% | 162 | 90% | 386 | 37% |
| Emergency management | 57 | 27% | 44 | 24% | 184 | 18% |
Key issues and opportunities:
- The following skills areas have been identified as being essential to build workforce capability and capacity:
- business skills (business acumen, business investment, business leadership, market/supply chain analysis, business development, transformation)
- evidence-based policy development and writing
- project management for large project complexity
- contract management
- marketing, promotion and investment attraction
- engagement (relationship building, influencing and persuasion)
- emergency management
- strong leadership culture that delivers outcomes
- change management and resilience
- Acquiring these skills by applying the 70/20/10 development concept with current staff and/or through recruitment or other models.
Employment status and gender
The workforce (988 FTE and 1086 headcount) comprises permanent, contract of service and casual staff. The ratio target of permanent to non-permanent staff is 80:20.
Since the Workforce and Diversity Plan 2012–15, the number of women with permanent employment status has increased when compared to men (the gap has narrowed from 13% to 8%). The proportion of contract staff has largely stayed the same.
Table 3: Employment status by gender
| Status | Permanent | Fixed-term contract | Short-term contract | Total |
|---|---|---|---|---|
| Females | 39% | 5% | 2% | 46% |
| Males | 47% | 4% | 3% | 54% |
| Total | 86% | 9% | 5% | 100% |
The gender mix is currently 46% women and 54% men. The vast majority work full time (82%) and consistent with industry workforce trends, a greater proportion of women work part time (15%) as compared to men (3%).
Table 4: Employment type by gender
| Full time | Part time | Total | |
|---|---|---|---|
| Females | 32% | 15% | 46% |
| Males | 51% | 3% | 54% |
| Total | 82% | 18% | 100% |
Key issues and opportunities:
The externally funded seasonal and finite project work presents challenges in balancing permanent and temporary employment opportunities.
The management of permanent staff engaged on Royalties for Regions and externally funded projects is paramount to ensure they are effectively reassigned as these finite projects conclude.
Age profile
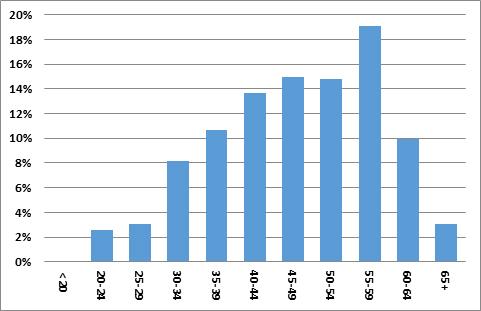
Nearly a third (32%) of staff are currently eligible to retire (at or above preservation age 55 years old), and this will increase to nearly a half (47%) within the next five years.
The workforce age profile is comparable between metropolitan and regionally based staff. Only 6% of staff are younger than 30 years of age.
The staff turnover rate is 5.7% and is slightly above the WA public sector average of 4.2%.
It is anticipated that this will marginally increase over the duration of this plan due to the ageing workforce.[1]
Figure 3: Staff age profile
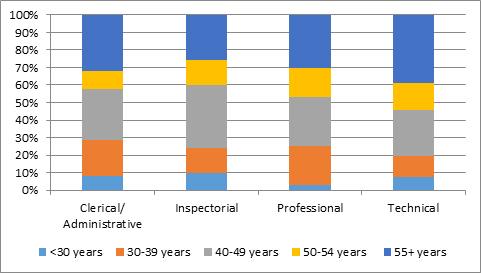
There is a large proportion of mature age technical staff and a small proportion of professional staff below 30 years of age.
Figure 4: Work function by age group
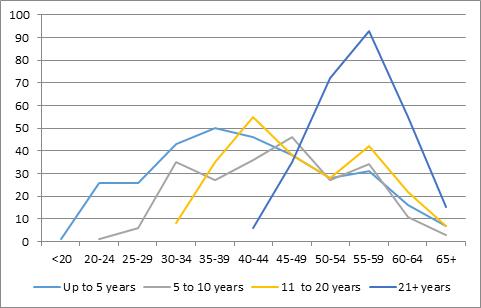
During the past five years, new staff have been employed across all age groups with the majority aged between 30 and 49 years.
Figure 5: Staff length of service by age group
Key issues and opportunities:
- Managing an ageing workforce with work arrangements that support staff during all stages of work life, to ensure continued high level productivity.
- As staff separation rates increase, processes for managing intellectual capital and capturing corporate knowledge within departmental systems are required.
- Effective succession planning through strategic recruitment of early and mid-career staff to support succession planning and knowledge transfer.
- Appropriate induction and training for new employees, or employees moving into new roles, such as people leader.
- Consideration of additional intakes of the Graduate program to support career development and workforce succession planning objectives.
Directorate workforce planning
Directorate workforce plans inform, create and deliver the strategies and initiatives of the plan; the achievement of which are dependent upon commitment and action at the Directorate level.
Directorate workforce plans outline strategies relating to appropriate workforce composition, capabilities development and diversity outcomes.
This is achieved through scenario planning based upon analysis of the workforce and diversity profile, capability and skills mix, and workforce supply and demand.
Succession planning for mission critical and high priority positions is managed at the directorate level and integrated into directorate workforce plans.
Equity and diversity planning
Equity and diversity profile
An integral part of the plan focus is addressing equity and diversity issues. Effective diversity planning has the ability to positively impact upon staff capability and productivity.
The key principles that underpin this plan are ensuring:
- the workplace is free from racial and sexual harassment
- employment practices do not discriminate against existing or potential employees
- there is an inclusive and accepting workforce culture.
DAFWA’s Disability Access and Inclusion Plan 2015-19 (DAIP) and Reconciliation Action Plan 2015-18 (RAP), further support the commitment to attracting and developing strong relationships with people from diversity groups.
The plan identifies and sets specific corporate priorities and actions, supported by directorate workforce plans, to achieve by the end of 2018.
The plan is designed to promote and achieve diversity outcomes and supports the legislative requirements of the Equal Employment Opportunity Act WA 1984.
Equity profile
The equity profile is the percentage representation of the workforce from target diversity groups.
Table 5: Equity profile - percentage representation at 30 June of each year
| Status | 20083 | 20091 | 20101 | 20111 | 20121 | 20134 | 20145 | 20156 |
|---|---|---|---|---|---|---|---|---|
| Women – tier 2 | 0.0% | 0% | 15.4% | 14.3% | 0.0% | 6.7% | 0.0% | 0.0% |
| Women – tier 3 | 24.0% | 26.7% | 0.0% | 17.2% | 23.1% | 23.4% | 31.6% | 33.3% |
| Indigenous Australians | 2.6% | 2.0% | 2.0% | 1.8% | 2.0% | 1.5% | 1.6% | 1.4% |
| People with culturally diverse backgrounds | 12.9% | 15.9% | 13.0% | 13.9% | 13.8% | 14.8% | 15.1% | 14% |
| People with disability | 2.2% | 2.8% | 2.9% | 2.3% | 2.4% | 2.2% | 1.9% | 1.8% |
| Youth (under 25 years) | 6.0% | 7.4% | 3.1% | 3.1% | 3.5% | 1.9% | 2.5% | 2.9% |
| Mature (>= 45 years) | NA | NA | NA | NA | NA | 63.8% | 63.1% | 62.3% |
3 “How does your agency compare 2012?” From the Director of Equal Opportunity in Public Employment, page 5
4 State of the Sector Statistical Bulletin 2013, page 32
5 State of the WA Public Sector Statistical Bulletin 2014, pages 23 and 26
6 State of the WA Public Sector Statistical Bulletin 2015, pages 23 and 26
Equity index
The equity index is a measure of distribution. It compares the distribution of diversity groups in the workforce to the distribution of the workforce as a whole. If the group has a similar distribution across all levels as the total workforce the equity index is 100 (ideal). An index less than 100 indicates compression of the group at the lower levels. An index greater than 100 indicates compression of the group at the higher levels.
Table 6: Distribution (equity index) at 30 June of each year
| Status | 20083 | 20093 | 20103 | 20113 | 20123 | 20134 | 20145 | 20156 |
|---|---|---|---|---|---|---|---|---|
| Women | 51.4 | 53.0 | 63.5 | 62.0 | 63.6 | 66.0 | 70.2 | 66.5 |
| Indigenous Australians | 14.3 | 20.0 | 26.1 | 31.8 | 24.1 | 32.0 | 39.7 | 37.8 |
| People with culturally diverse backgrounds | 111.0 | 80.3 | 109.9 | 105.0 | 95.6 | 107.0 | 181.0 | 89.7 |
| People with disability | 84.7 | 97.8 | 80.2 | 104.0 | 83.9 | 109.0 | 96.0 | 103.5 |
Key issues and opportunities:
- Attracting and developing women at senior management levels.
- Providing flexible working arrangements to women while enabling professional and career development opportunities.
- Encouraging women to apply for acting, mentoring and leadership roles.
- Attraction and retention of Aboriginal and Torres Strait Islander employees.
- Development and implementation of a cadetship and/or graduate programs to support key strategic succession planning initiatives aimed at creating employment opportunities for youth.
- Directorates to consider previously identified positions to provide employment opportunities, with discreet job tasks, for people with disability.
Diversity targets
This plan and directorate workforce plans formalise corporate and directorate strategies and measures towards the achievement of targets for the representation and distribution of staff from diversity groups.
Table 7: DAFWA Diversity targets 2017 to 2019
| Diversity groups | Public sector Sept 2015 (actual) | DAFWA Dec 2015 | DAFWA June 2017 | DAFWA June 2018 | DAFWA June 2019 |
|---|---|---|---|---|---|
| Representation (%) | |||||
| Women in management tiers 2 and 3 combined | 42.0 | 35.1 | 36.0 | 38.0 | 40.0 |
| Indigenous Australians | 2.8 | 1.3 | 1.5 | 1.6 | 1.7 |
| People from culturally diverse backgrounds | 12.4 | 15.3 | 15.4 | 15.5 | 15.6 |
| People with disability | 2.1 | 1.6 | 1.65 | 1.7 | 1.75 |
| Youth (<25 years) | 4.4 | 2.9 | 3.0 | 3.1 | 3.2 |
| Distribution (equity index) | |||||
| Women | 73.3 | 68.3 | 69.0 | 71.0 | 73.0 |
| Indigenous Australians | 40.9 | 27.2 | 28.0 | 29.0 | 30.0 |
| People from culturally diverse backgrounds | 100.0 | 93.1 | 94.0 | 95.0 | 96.0 |
| People with disability | 100.3 | 78.0 | 79.0 | 80.0 | 81.0 |
Plan priorities
Analysis of departmental context with the workforce profile has highlighted a number of key challenges and opportunities both now and into the future. To address these challenges and opportunities, workforce priorities have been identified and form the basis of this plan.
Workforce priorities are as follows:
- Priority 1 – Highest quality employees in all locations.
Attract, manage and retain high-performing, committed and diverse employees and leaders in all locations and support continuous improvement in their capacity to deliver excellent outcomes. - Priority 2 - Empowered and capable people leaders.
Develop leadership capabilities to drive priorities and partner with industry and other government agencies. We will build further our capacity to demonstrate innovative and efficient leadership practices. - Priority 3 – Planning for critical positions.
Identifying DAFWA mission critical positions and high-priority positions within directorates and developing staff with the potential to fill key leadership positions. These processes will include attracting, developing and retaining people from diversity groups. - Priority 4 – New and better ways of doing business.
Innovate and improve our ways of doing business through workforce and diversity planning, flexible recruitment and management practices and streamlined policies and processes. Implementing substantive equality by adjusting policies, procedures and practices to meet the specific needs of certain groups of people.
Initiatives
A range of initiatives have been identified to progress the plan priorities.
These initiatives and current strategies are based upon the employee lifecycle model, comprising the stages of workforce planning, recruitment, induction, management, development and separation.
Workforce planning
Workforce planning is the systematic identification, analysis and planning of organisational needs in terms of people. Making informed decisions about management practices, aligned to organisational goals and community needs to build and maintain a skilled, flexible and sustainable workforce. It is about having a wide range of people with the right skills, doing the right jobs at the right time.
Workforce planning is a dynamic process, involving frequent modifications of direction in response to changing conditions taking into account factors including ageing population, turnover rates, budget impacts, industry needs and legislation. Tailoring workforce strategies to acknowledge and include a diverse range of people facilitates a positive, dynamic, high-performance and robust workforce.
Workforce planning often includes the transitioning of people to new roles and their development of new skills and it is therefore important there is a holistic approach through people leaders working closely with senior and program managers.
Good workforce data is essential to monitoring progress and Executive will be regularly updated on key workforce and organisational culture performance.
Table 8: Workforce planning initiatives
| Actions | Workforce priority | Responsibility - oversight | Responsibility - implementation | Timeframe | Measure | Monitoring and evaluation |
|---|---|---|---|---|---|---|
| Report quarterly to Executive on diversity targets and progress of the plan. | Priorities 1 to 4 | Manager People Strategy and Workplace Reform (PSWR) | HR Systems Analyst People Leadership Advisors (PLAs) | Quarterly | Dashboard report is provided to Executive quarterly | Quarterly report is effective and fit for purpose |
| Evaluate, review and amend the workforce and diversity plan. | Priorities 1 to 4 | Manager PSWR | Executive Directors/ PLAs | 30 June, annually | Successful implementation of initiatives and progress against targets. Evaluation framework developed | Annual report on progress and evaluation of the plan to Executive |
| Reflect equity and diversity principles in strategic plan review. | Priorities 1 to 4 | Director Strategy and Governance | Director Strategy and Governance Executive Directors | December 2017 | Principles incorporated | EEO and diversity incorporated in strategic plan |
| Reflect equity and diversity principles in operational plans. | Priorities 1 to 4 | Director Strategy and Governance | Executive Directors | July, annually | Principles incorporated | EEO and diversity incorporated in operational plans |
| Inclusion of equity and diversity objectives in:
| Priorities 1 to 4 | Director Strategy and Governance Executive Directors | Director Strategy and Governance PLAs | June, annually Annually | Agreed performance agreement Agreed MyPlan | Quarterly report to executive and annual performance agreement review |
| Communicate the plan and its policies and programs to staff via internal communication tools and training programs. | Priorities 1 to 4 | Executive Directors Director Communications and Promotions | Directorate Communications Officer Manager PSWR | 30 June, annual reporting | Plan is communicated | Included in annual report on progress of plan to Executive |
| Staff to update their diversity profile to provide for contemporary diversity data. | Priorities 1 to 4 | Manager Organisational Development and Training Unit (ODTU) | Project Officer Equity and Diversity PLAs | December, annually | Staff requested to update their diversity profile | Number of employees that updated their diversity profile |
| Profile the employment of women at DAFWA to develop strategies for their progression internally. | Priorities 1 to 4 | Manager ODTU | Project Officer Equity and Diversity | September 2017 | Audit conducted | Strategies approved by Executive |
| Review directorate workforce plans, including workforce capabilities analysis and plan monitoring and evaluation. | Priorities 1 to 4 | Manager PSWR | Executive Directors, supported by their Senior Leadership Team (SLT) and PLA | June 2017, annually | Approved by executive and implemented | Quarterly report to Executive |
| Implement the strategic relocation of positions plan. | Priority 1 | Executive Directors | Directors | December 2016 | Positions relocated | Quarterly report to Executive |
| Review of DAFWA mission critical positions and high-priority directorate positions. Succession plans in place for these positions. | Priority 3 | Executive Directors | PLAs | December 2016, annually | Positions reviewed and succession plans in place | Annual review |
| Review the contractual arrangements of staff against finite projects and develop workforce planning strategies, as appropriate. | Priorities 1 and 3 | Executive Directors Manager PSWR | Directors PLAs | December 2016 | Review complete and strategies developed, as appropriate | Strategies approved by Executive |
| Implement the Disability Access and Inclusion Plan 2015–19 (DAIP) and Reconciliation Action Plan 2015–18 (RAP). | Priorities 1 to 4 | Manager ODTU | Project Officer Equity and Diversity | As per implementation plans | As per implementation plans | As per implementation plans |
Recruitment and selection
Recruitment and selection is about having people with the right skills doing the right jobs at the right time in the right location.
Through the people leadership program, consideration is given by people leaders and project managers to the needs and skill requirements of projects as well as longer-term corporate needs.
There are a number of targeted recruitment programs that support the achievement of diversity outcomes (some linking in with public sector-wide programs), including apprenticeships, traineeships, internships, cadetships, graduate programs, and Aboriginal and Torres Strait Islander traineeship and cadetship programs.
Table 9: Recruitment and selection initiatives
| Actions | Workforce priority | Responsibility – oversight | Responsibility – implementation | Timeframe | Measure | Monitoring and evaluation |
|---|---|---|---|---|---|---|
| Review current recruitment and selection activities, policies and procedures and develop and implement strategies to enhance equity and diversity outcomes. | Priorities 1, 3 and 4 | Manager People Operations | People leaders and senior leadership team supported by PLAs Managers Management Services (MMS) in consultation with regional directors | December 2017 Ongoing | Approved by executive and implemented | Recruitment and selection data reported on a half yearly basis |
| Review online recruitment system ‘Big Red Sky’ for the ability to:
| Priorities 1, 3 and 4 | Manager People Operations | Recruitment officer | June 2018 | System reviewed Data collected and analysed | Recruitment and selection data reported on a half-yearly basis and used to inform workforce planning |
| Include a duty/responsibility for managing equity and diversity in job description forms of management positions. | Priorities 1 and 4 | Manager People Operations | Recruitment officer People leaders Project managers | Ongoing, as job description forms are revised | Job description forms revised | Revised when advertised, newly created and during workplace reviews. |
Induction
Employee induction programs provide a structured approach in welcoming new colleagues, delivering critical information about the organisation and job role and also clarifying expectations in the employment relationship. Addressing employee expectations at this stage will often reassure that they have made the right employment decision and form a basis for greater retention, job satisfaction and engagement.
The induction program contains four key elements:
- Local occupational safety and health (OSH) induction that commences on day one and completed in the first month of employment
- Corporate induction that consists of online training and a face to face meeting with representatives of the executive team
- Performance planning and development (MyPlan) which is completed within the first month of employment
- Essential training that is ideally completed within the first three months of employment for new employees, and refresher training completed periodically.
Table 10: Induction initiatives
| Actions | Workforce priority | Responsibility – oversight | Responsibility –implementation | Timeframe | Measure | Monitoring and evaluation |
|---|---|---|---|---|---|---|
| Review the induction program. Update as necessary. | Priorities 2 and 4 | Manager ODTU Manager OSH People leaders | Learning and Development Consultant People leaders | June 2018 | Induction program reviewed | Effectiveness of induction program and participation of new staff |
Management
This is a broad area which incorporates many of the day-to-day management and operational functions linked to strategic objectives, including:
- balancing the quality of life of the staff member against workload demands
- ensuring compliance with the public sector requirements in human resource management
- adopting a sound risk management approach in people leadership decision making and activities.
Development
A range of learning and development opportunities are delivered at a corporate level to support strategic capability objectives. People leaders need to be equipped with the skills to support the learning and development of others as identified and managed through MyPlan conversations.
The model applied is the 70/20/10 development concept which suggests a notional blend of:
- 70% informal, on the job, experience based, stretch projects and practice
- 20% coaching, mentoring, developing through others (network)
- 10% formal learning interventions and structured courses.
Table 11: Management and development initiatives
| Actions | Workforce priority | Responsibility – oversight | Responsibility – implementation | Timeframe | Measure | Monitoring and evaluation |
|---|---|---|---|---|---|---|
| Develop and implement an online system to capture the development and training needs of staff identified in MyPlan. | Priorities 2, 3 and 4 | Manager ODTU | Learning and Development Consultant Manager People Systems | June 2018 | Research undertaken and system in place | Evaluation of system completed yearly and reported to Executive |
| Recruit, appoint and provide ongoing training and development for contact/grievance officers to assist in resolving EEO grievances. | Priorities 1 and 4 | Manager ODTU | Project Officer equity and diversity | July, annually | Recruitment completed Workshops delivered | Annual report to Executive |
| Review and amend the grievance policy as necessary, promote the policy to all employees. | Priorities 1 and 4
| Manager ODTU Executive Directors | Project Officer equity and diversity | Review June 2018, promotion six monthly | Policy reviewed and amended and promoted | Number of grievances reported to Executive annually |
| Review and develop the staff engagement model. | Priorities 1 to 4 | Manager ODTU Executive Directors | Manager ODTU and PLAs | June 2018 | Model and implementation plan developed and communicated | As per implementation plan |
| Design and implement a development program for people leaders | Priority 2 | Manager ODTU | Learning and Development Consultant PLAs | June 2017 | Program in place | People leaders participating in program activities |
| Development of leadership and management skills of women using 70/20/10 approach | Priorities 1 to 4 | Executive Directors Manager ODTU | People leaders, with the assistance of PLAs Learning and Development Consultant | September 2017 | Learning and development documented in MyPlans Succession plans in place Talent management program developed, as appropriate | Women capabilities development and representation in senior management |
| Develop strategies to build capability and capacity in key skill areas identified in this plan | Priorities 1 and 3 | Executive Directors Manager ODTU | PLAs Learning and Development Consultant | December 2016 | Key skill areas identified in directorate workforce plans Strategies developed at directorate and corporate level, as appropriate | Capabilities development and ongoing review of directorate workforce plans |
Separation
Employees leave for a variety of reasons and through the separation process the impression left within exiting employees may be shared with others, support their return and impact on the department’s reputation as a good employer.
A structured separation process provides an opportunity to gain insight into exiting employees’ views of their working experience to assist in the identification of opportunities to improve workplace conditions and culture.
Quality of life strategies and flexible work practices are available to assist staff transitioning to retirement, including access to superannuation seminars and personal financial management courses.
Table 12: Separation initiatives
| Actions | Workforce priority | Responsibility – oversight | Responsibility – implementation | Timeframe | Measure | Monitoring and evaluation |
|---|---|---|---|---|---|---|
| Improve the collation and analysis of exit information relevant to the retention of employees, with a view to using it to develop strategies to retain employees and identify equity and diversity issues. | Priorities 1, 3 and 4 | Manager PSWR | PLAs and people leaders | December 2016 and ongoing | Data analysed and report provided to Executive | Quarterly report to Executive |
| Investigate the viability of developing online systems to capture information from exiting employees. | Priorities 3 and 4 | Manager PSWR | Manager People Systems in consultation with PLAs | December 2016 | Viability report | System implemented if feasible |
Key achievements
Key achievements from the Workforce and diversity plan 2012–15 include:
Workforce planning initiatives
- Corporate diversity targets developed (2016).
- Staff diversity survey conducted to obtain accurate data (2015).
- Developed the third Disability Access and Inclusion Plan (DAIP), covering 2015–19, and the associated implementation plan (2015).
- Developed the third Reconciliation Action Plan, covering 2015–18, and the associated implementation plan (2015).
- Equity and diversity objectives included in the Director General’s performance agreement each year (2012–15).
- A modified version of the Public Sector Commission’s dashboard was developed and provided to Executive quarterly (2014).
- Equity and diversity principles reflected in the Agrifood 2025+ Strategic plan 2014–17 (2014).
- Strategic relocation plan approved by Executive (2014).
- DAFWA EEO management plan 2010-2013 integrated into the DAFWA Workforce and diversity plan 2012–15 (2014).
Management and development initiatives
- The MyPlan template was reviewed to allow accessibility and flexibility for all positions, including technical officers, people leaders and project managers (2015).
- A structured development program for graduates was implemented in 2014. In early 2015, the six graduates relocated to work in regional offices, taking the skills they developed in the first year of the graduate program to their new roles.
- Grievance policy updated (2015).
- Contact/grievance officers annually recruited, appointed and trained to assist in resolving EEO grievances (2012–15).
- Staff engagement survey conducted in 2013. During 2014 and 2015, a series of staff focus groups resulted in a comprehensive understanding of key issues leading to 90-day challenge action planning process at corporate, directorate and local levels. Staff engagement pulse check survey was run in 2014.
Induction initiatives
- The essential training component of the corporate induction process has now predominantly moved online, increasing the accessibility of courses further supporting compliance. In addition, a number of key courses now require refresher training to maintain staff currency in knowledge (2015/16).
- Essential online training courses have been updated to include substantive equality messages (2015/16).
- An online induction course has been developed for people leaders (2014).


