Workforce planning
This section of the plan provides information on the department’s workforce profile and outlines the key strategies and initiatives needed to meet existing and future workforce needs. Data is as at December 2015 unless otherwise stated.
Workforce profile
Location
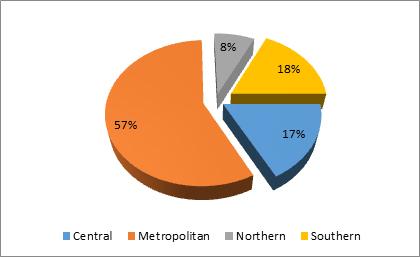
Nearly half (43%) of staff are located in regional locations. This compares to only 24.6%1 across the public sector.
Figure 1: Workforce by region
Key issues and opportunities:
- The state government’s focus on regional development, particularly through the Royalties for Regions initiative, will over time see an increase in the percentage of regionally based public sector employees.
- The challenge is to maintain and grow this proportion of regionally based staff (target is 50%) and requires initiatives to address staff attraction, recruitment and retention through considering whether services traditionally delivered from South Perth can be relocated to regional locations, particularly when considering the filling of vacant positions.
- Meeting the strategic objective of relocating identified metropolitan positions to regional locations is to be achieved by December 2016.
1 Data based on Quarterly Entity Profile Sept 2015.
Skill and capability
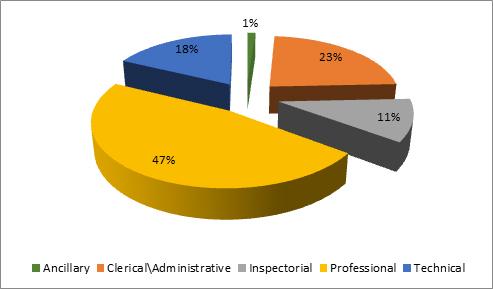
The workforce is categorised by work function with the majority undertaking professional duties.
Figure 2: Work function profile
Further analysis by position title identifies the main skill areas of technical and professional (research).
Table 1: Skill areas by position title
| Skill areas by position title | Percentage |
|---|---|
| Technical | 17.6% |
| Professional (research) | 17.2% |
| Professional (development) | 9.4% |
| Professional (biosecurity) | 3.6% |
| Inspectorial | 10.9% |
| Management | 10.9% |
| Clerical/administrative (ex-administrative officer) | 10.7% |
| Administrative officer | 7.2% |
| Project management | 4.4% |
| Policy | 3.6% |
| Client engagement, marketing and communications | 2.2% |
| Economist | 1.2% |
| Ancillary (agricultural operative) | 0.6% |
| Ancillary (cleaner/other) | 0.2% |
| Market analyst | 0.2% |
There is ongoing commitment to building staff leadership and management capabilities; in particular people leaders and project managers. More recently, there has been a focus on building agricultural emergency response capabilities.
Table 2: Staff who have participated in a leadership or management training course
| Skill areas by position title | People leaders (no.) | People leaders (%) | Project managers (no.) | Project managers (%) | All staff (no.) | All staff (%) |
|---|---|---|---|---|---|---|
| Leadership and management | 178 | 85% | 131 | 73% | 480 | 46% |
| Project management | 157 | 75% | 162 | 90% | 386 | 37% |
| Emergency management | 57 | 27% | 44 | 24% | 184 | 18% |
Key issues and opportunities:
- The following skills areas have been identified as being essential to build workforce capability and capacity:
- business skills (business acumen, business investment, business leadership, market/supply chain analysis, business development, transformation)
- evidence-based policy development and writing
- project management for large project complexity
- contract management
- marketing, promotion and investment attraction
- engagement (relationship building, influencing and persuasion)
- emergency management
- strong leadership culture that delivers outcomes
- change management and resilience
- Acquiring these skills by applying the 70/20/10 development concept with current staff and/or through recruitment or other models.
Employment status and gender
The workforce (988 FTE and 1086 headcount) comprises permanent, contract of service and casual staff. The ratio target of permanent to non-permanent staff is 80:20.
Since the Workforce and Diversity Plan 2012–15, the number of women with permanent employment status has increased when compared to men (the gap has narrowed from 13% to 8%). The proportion of contract staff has largely stayed the same.
Table 3: Employment status by gender
| Status | Permanent | Fixed-term contract | Short-term contract | Total |
|---|---|---|---|---|
| Females | 39% | 5% | 2% | 46% |
| Males | 47% | 4% | 3% | 54% |
| Total | 86% | 9% | 5% | 100% |
The gender mix is currently 46% women and 54% men. The vast majority work full time (82%) and consistent with industry workforce trends, a greater proportion of women work part time (15%) as compared to men (3%).
Table 4: Employment type by gender
| Full time | Part time | Total | |
|---|---|---|---|
| Females | 32% | 15% | 46% |
| Males | 51% | 3% | 54% |
| Total | 82% | 18% | 100% |
Key issues and opportunities:
The externally funded seasonal and finite project work presents challenges in balancing permanent and temporary employment opportunities.
The management of permanent staff engaged on Royalties for Regions and externally funded projects is paramount to ensure they are effectively reassigned as these finite projects conclude.
Age profile
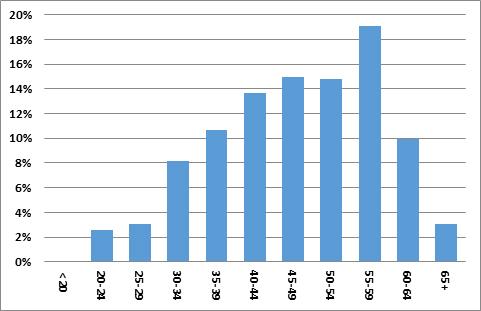
Nearly a third (32%) of staff are currently eligible to retire (at or above preservation age 55 years old), and this will increase to nearly a half (47%) within the next five years.
The workforce age profile is comparable between metropolitan and regionally based staff. Only 6% of staff are younger than 30 years of age.
The staff turnover rate is 5.7% and is slightly above the WA public sector average of 4.2%.
It is anticipated that this will marginally increase over the duration of this plan due to the ageing workforce.[1]
Figure 3: Staff age profile
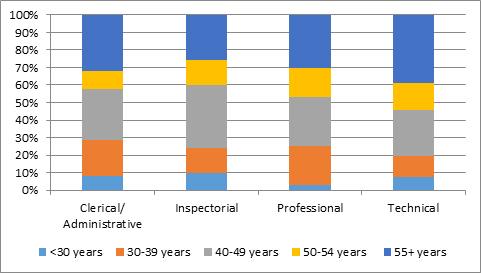
There is a large proportion of mature age technical staff and a small proportion of professional staff below 30 years of age.
Figure 4: Work function by age group
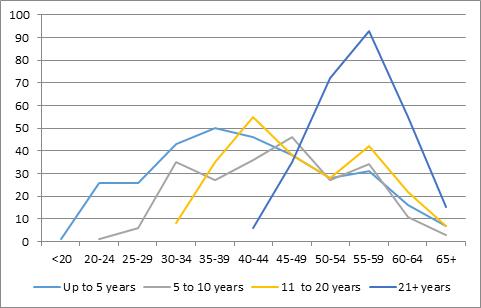
During the past five years, new staff have been employed across all age groups with the majority aged between 30 and 49 years.
Figure 5: Staff length of service by age group
Key issues and opportunities:
- Managing an ageing workforce with work arrangements that support staff during all stages of work life, to ensure continued high level productivity.
- As staff separation rates increase, processes for managing intellectual capital and capturing corporate knowledge within departmental systems are required.
- Effective succession planning through strategic recruitment of early and mid-career staff to support succession planning and knowledge transfer.
- Appropriate induction and training for new employees, or employees moving into new roles, such as people leader.
- Consideration of additional intakes of the Graduate program to support career development and workforce succession planning objectives.
Directorate workforce planning
Directorate workforce plans inform, create and deliver the strategies and initiatives of the plan; the achievement of which are dependent upon commitment and action at the Directorate level.
Directorate workforce plans outline strategies relating to appropriate workforce composition, capabilities development and diversity outcomes.
This is achieved through scenario planning based upon analysis of the workforce and diversity profile, capability and skills mix, and workforce supply and demand.
Succession planning for mission critical and high priority positions is managed at the directorate level and integrated into directorate workforce plans.

