Carbon Calculators – Western Australian grain and mixed farm examples
The carbon accounts of four example farm enterprises in the WA agricultural region were calculated using a tool designed specifically for Australian producers. The example farms were:
-
Eastern Wheatbelt 100% cropping enterprise
-
Eastern Wheatbelt mixed grain and sheep enterprise
-
Geraldton Medium Rainfall 100% cropping enterprise
-
Woolbelt mixed sheep and grain enterprise
The data for these examples has been established using the 2019 Planfarm Benchmarks, along with expertise and advice from local agronomists and other industry professionals.
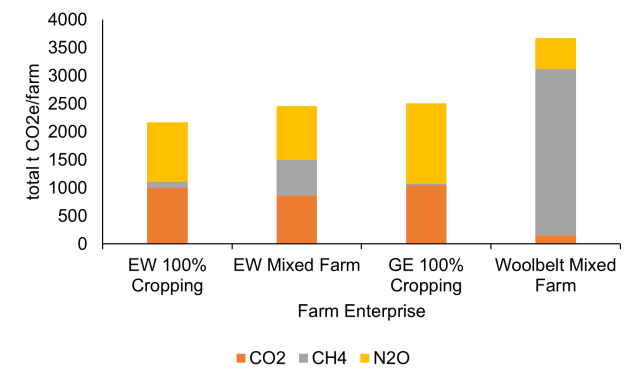
Comparing different farms, farm emissions as well as the composition of those emissions can vary greatly. While the Woolbelt mixed farm was the smallest in hectares, it had the largest number of livestock in the system, and the livestock have largely contributed to the farms total emissions compared to the other farm examples. The Eastern Wheatbelt (EW) 100% cropping farm had the lowest total emissions, as it was the farm with the lowest intensity of fertiliser and had no livestock (Figure 1).
The emission intensity remained similar between cropping systems however it was higher in the Geraldton (GE) 100% cropping example (table 1).
| Wheat | Barley | Pulses | Oilseeds | Sheep Meat | Sheep Wool | |
|---|---|---|---|---|---|---|
| t CO2-e/t crop | t CO2-e/t crop | t CO2-e/t crop | t CO2-e/t crop | kg CO2-e / kg LW | kg CO2-e / kg greasy | |
| EW 100% Cropping | 0.29 | 0.31 | 0.24 | 0.70 | ||
| EW Mixed Farm | 0.29 | 0.31 | 0.24 | 0.70 | 8.10 | 29.40 |
| GE 100% Cropping | 0.36 | 0.41 | 0.26 | 0.88 | ||
| Woolbelt Mixed Farm | 0.29 | 0.31 | 7.63 | 28.54 |
These farm examples provide some ballpark emission figures and compositions for different farm enterprises and locations. They are jumping off points for producers to then go and utilise their own farm and its systems to investigate their own carbon emissions.
More detail of the farm examples and emissions following.


