Central Woolbelt
The Central Woolbelt covers both medium and high rainfall zones the South West Australian agricultural region. These farms are generally moderate in size, ranging from 3000ha to 4500ha in size and have a larger livestock enterprise, predominantly sheep. Large proportions of farms are also suitable for cropping.
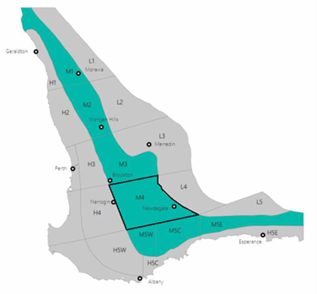
The Central Woolbelt mixed farm example has been based in the agro-ecological zone M4 (figure 14). This zone has annual rainfall averages 385mm. The year of this example experienced 199mm of growing season rainfall (April to September). This farm has 3000ha of arable land available, and 40% of the land is used for the cropping enterprise and 60% for the livestock, sheep enterprise.

The sheep enterprise is a self-replacing merino ewe flock of 6000 ewes. Lambing is in June and the farm achieves a 100% lambing rate. No crops are grazed, and pastures are improved, and legume based. Crops grown are wheat and barley (table 5).
| Input Summary |
| Wheat | Barley |
| Average grain yield (t/ha) | 1.95 | 2.23 | |
| Area sown (ha/farm) | 400 | 600 | |
| Nitrogen Fertiliser Use (kg N/ha) | 30 | 30 | |
| Urea Application (included in the above) (kg Urea/ha) | 25 | 25 | |
| Mass of Lime Applied (kg/ha) | 0 | 0 | |
| Fraction of the annual production of crop that is burnt (F) (ha/total crop ha) | 0.05 | 1.00 | |
| Herbicide/Pesticide use (kg total) | 1234 | 1851 | |
| Single Superphosphate (kg/ha) | 8.75 | 8.75 | |
| Annual Diesel Consumption (L/year) | 7733 | 11600 |
In this example with a larger sheep enterprise and higher sheep numbers, the main emission contributor is enteric methane (75%) (see appendix C).
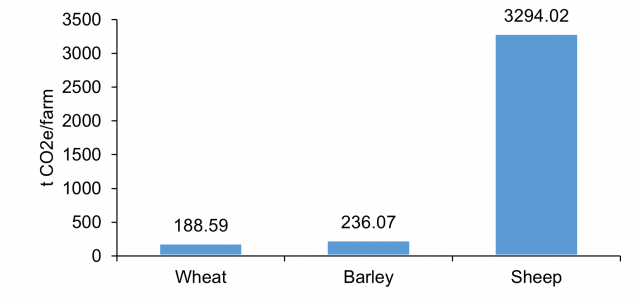
Net farm emissions were 3719 t CO2-e/farm. Most of the emissions were observed from the sheep, with wheat and barley contributing very little in comparison (figure 15).
The emission intensities for the wheat and barley were similar to those observed in the Eastern Wheatbelt examples (wheat 0.29 t CO2-e/t crop, barley 0.31 t CO2-e /t crop). The sheep enterprises had an emission intensity of 7.63 kg CO2-e / kg LW for meat and 28.54 kg CO2-e / kg greasy for wool.
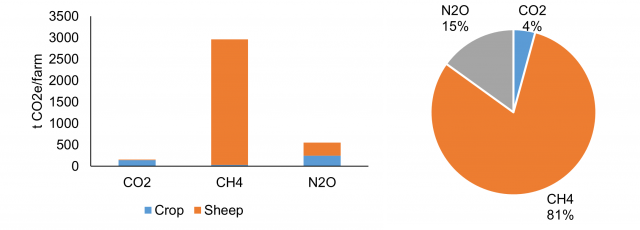
Farm methane was the major contributor to emissions with 81% of carbon equivalents coming from methane. 15% was contributed from nitrous oxides and 4% from carbon dioxides (figure 16).
The GAF tools used for these calculations are freely available here to run your own farm.


