Geraldton medium rainfall region
The Geraldton region covers high rainfall regions (500mm) close to the coast to low rainfall regions (250-300mm) towards the eastern and northern margins. These farms are generally larger, have both 100% cropping and mixed enterprises. Livestock numbers are generally found in higher numbers in the Dalwallinu and Northampton shires. Wheat is the primary crop produced, other key crops include lupins, barley, and canola.
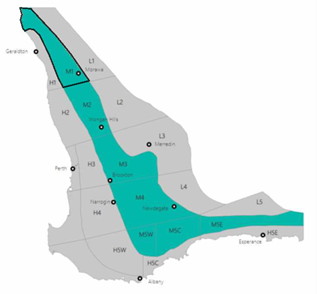
This example farm has been situated in the medium rainfall area, in the agro-ecological zone M1 (figure 9). The annual rainfall can vary between 325 and 450mm. This example has a 227mm growing season rainfall (April to September), it is a sole cropping enterprise with no livestock, and has 5450ha of arable land. 67% is sown to cereals (wheat and barley), 15% to pulses (lupins), and 18% to oilseeds (canola).
The input summary outlines the key inputs used for the carbon calculations (table 4).
| Input Summary |
| Wheat | Barley | Pulse | Oilseed |
| Average grain yield (t/ha) | 1.40 | 1.20 | 0.90 | 0.60 | |
| Area sown (ha/farm) | 3000 | 650 | 800 | 1000 | |
| Nitrogen Fertiliser Use (kg N/ha) | 54 | 54 | 0 | 54 | |
| Urea Application (included in the above) (kg Urea/ha) | 44 | 44 | 0 | 44 | |
| Mass of Lime Applied (kg/ha) | 250 | 0 | 0 | 250 | |
| Fraction of the annual production of crop that is burnt (F) (ha/total crop ha) | 0 | 0 | 0 | 0 | |
| Herbicide/Pesticide use (kg total) | 9258 | 2006 | 3937 | 5375 | |
| Single Superphosphate (kg/ha) | 24.3 | 24.3 | 24.3 | 24.3 | |
| Annual Diesel Consumption (L/year) | 66776 | 14468 | 17807 | 22259 |
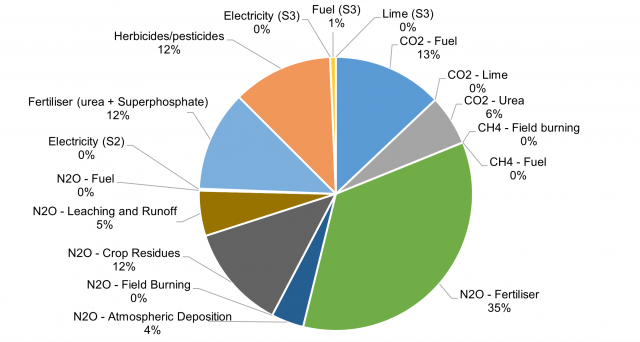
In this farm example, nitrous oxide fertiliser emissions were the largest contributor to CO2-eemissions (35%), followed by carbon dioxide from fuel (13%) (figure 10, see appendix B).
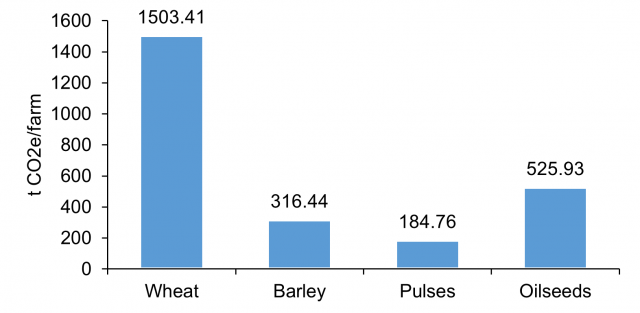
Net farm emissions totalled 2531 t CO2-e/farm. With the largest proportion of emissions coming from Wheat (figure 11).
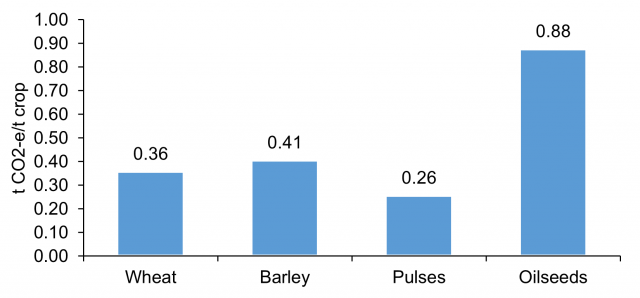
The oilseed (canola) crops had the highest emission intensity, the wheat and barley crops had similar emission intensities and the pulses had the lowest (figure 12).
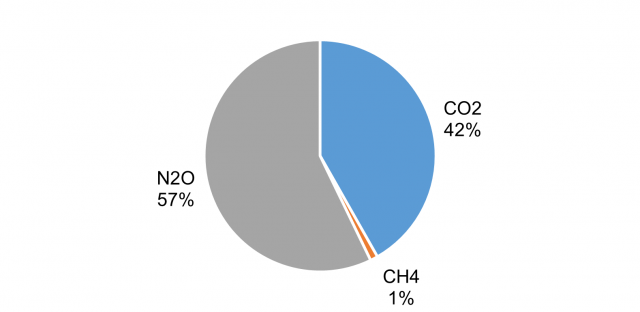
The CO2-eemissions were weighted toward carbon dioxide (57%), and nitrous oxide (47%), with very little Methane (1%) emissions (figure 13). This is to be expected when no sheep are present on farm.
The GAF tools used for these calculations are freely available here to run your own farm.

